Motivating Questions
- What is a slope field?
- How can we use a slope field to obtain qualitative information about the solutions of a differential equation?
- What are stable and unstable equilibrium solutions of an autonomous differential equation?
In earlier work, we have used the tangent line to the graph of a function at a point to approximate the values of near The usefulness of this approximation is that we need to know very little about the function; armed with only the value and the derivative we may find the equation of the tangent line and the approximation
Remember that a first-order differential equation gives us information about the derivative of an unknown function. Since the derivative at a point tells us the slope of the tangent line at this point, a differential equation gives us crucial information about the tangent lines to the graph of a solution. We will use this information about the tangent lines to create a slope field for the differential equation, which enables us to sketch solutions to initial value problems. Our aim will be to understand the solutions qualitatively. That is, we would like to understand the basic nature of solutions, such as their long-range behavior, without precisely determining the value of a solution at a particular point.
Preview Activity
Let's consider the initial value problem
a. Use the differential equation to find the slope of the tangent line to the solution at Then use the initial value to find the equation of the tangent line at Sketch this tangent line over the interval on the axes provided in Figure .
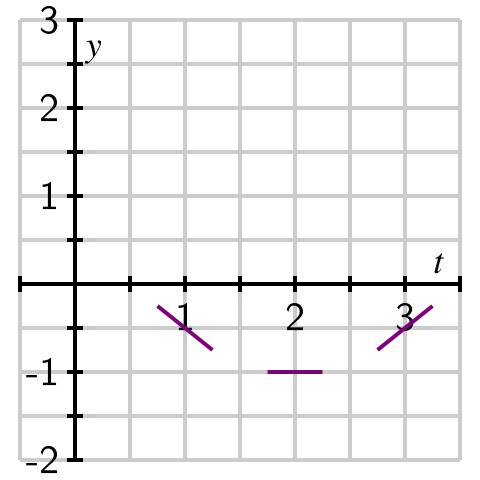
b. Also shown in Figure are the tangent lines to the solution at the points and (we will see how to find these later). Use the graph to measure the slope of each tangent line and verify that each agrees with the value specified by the differential equation.
c. Using these tangent lines as a guide, sketch a graph of the solution over the interval so that the lines are tangent to the graph of
d. Use the Fundamental Theorem of Calculus to find the solution to this initial value problem.
e. Graph the solution you found in (d) on the axes provided, and compare it to the sketch you made using the tangent lines.
Slope fields
Preview Activity shows that we can sketch the solution to an initial value problem if we know an appropriate collection of tangent lines. We can use the differential equation to find the slope of the tangent line at any point of interest, and hence plot such a collection.
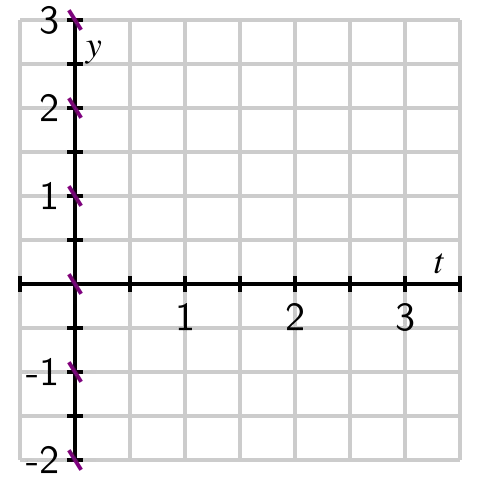
Let's continue looking at the differential equation If this equation says that Note that this value holds regardless of the value of We will therefore sketch tangent lines for several values of and with a slope of as shown in Figure .
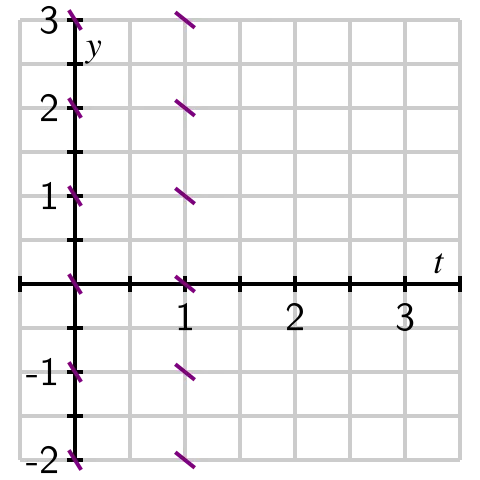
Let's continue in the same way: if the differential equation tells us that and this holds regardless of the value of We now sketch tangent lines for several values of and with a slope of in Figure .
Similarly, we see that when and when We may therefore add to our growing collection of tangent line plots to achieve Figure .
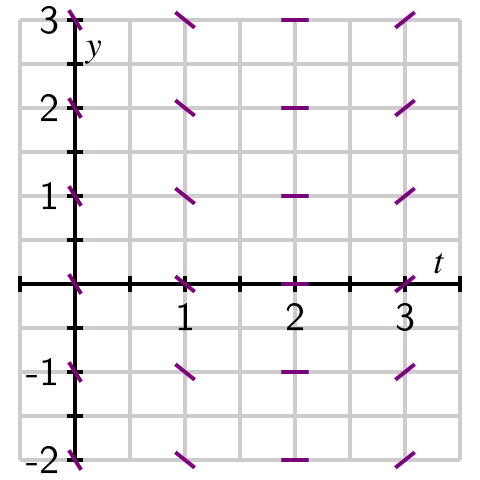
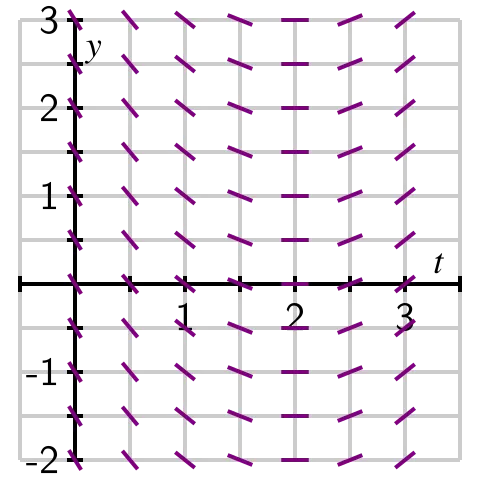
In Figure , we begin to see the solutions to the differential equation emerge. For the sake of even greater clarity, we add more tangent lines to provide the more complete picture shown at right in Figure .
Figure is called a slope field for the differential equation. It allows us to sketch solutions just as we did in the preview activity. We can begin with the initial value and start sketching the solution by following the tangent line. Whenever the solution passes through a point at which a tangent line is drawn, that line is tangent to the solution. This principle leads us to the sequence of images in Figure .
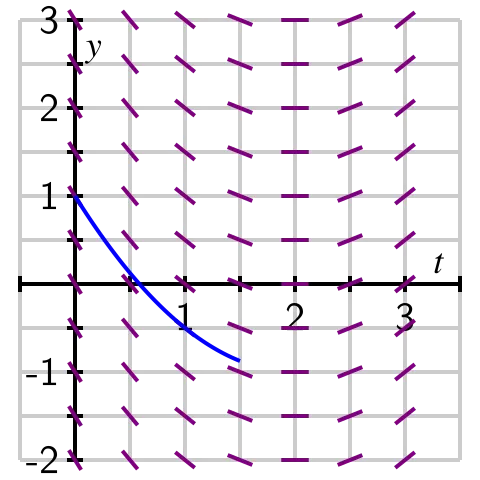
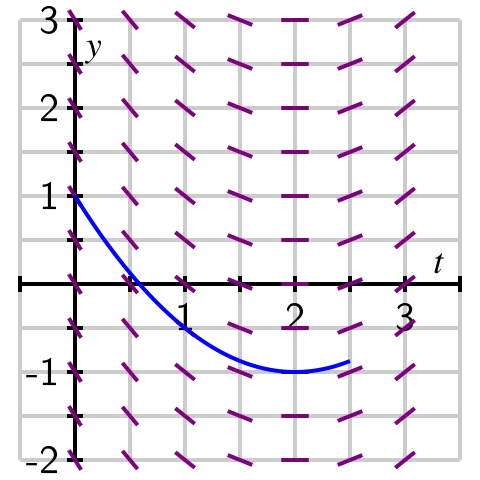
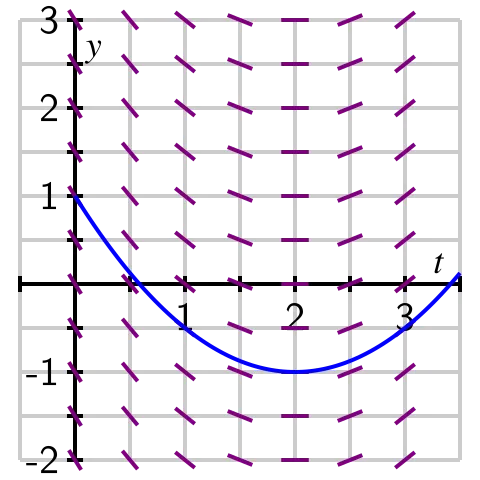
In fact, we can draw solutions for any initial value. Figure shows solutions for several different initial values for
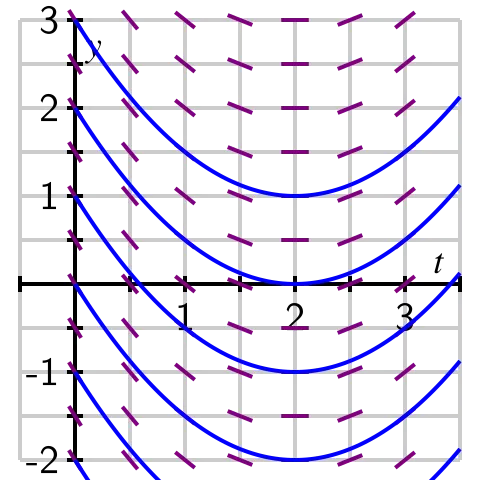
Just as we did for the equation we can construct a slope field for any differential equation of interest. The slope field provides us with visual information about how we expect solutions to the differential equation to behave.
Activity
Consider the autonomous differential equation
- Make a plot of versus on the axes provided in Figure . Looking at the graph, for what values of does increase and for what values of does decrease?
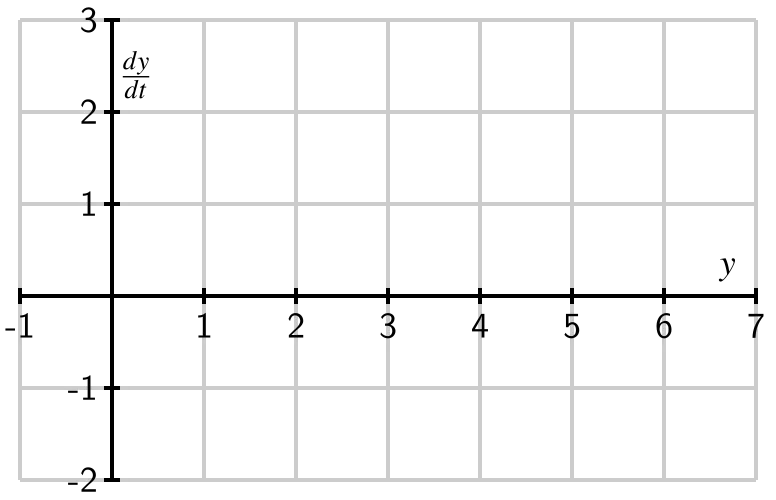
Figure : Axes for plotting versus 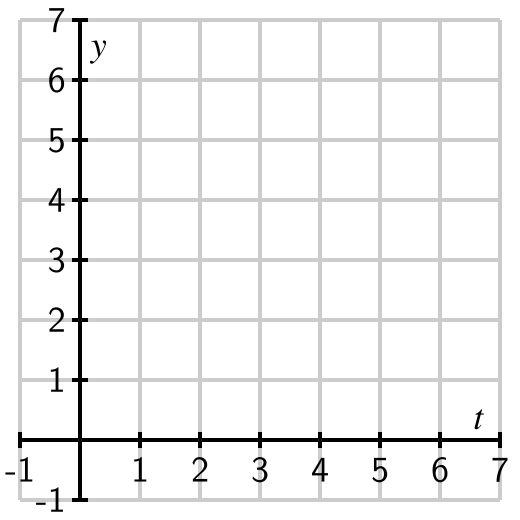
Figure : Axes for plotting the slope field for - Next, sketch the slope field for this differential equation on the axes provided in Figure .
- Use your work in (b) to sketch (on the same axes in Figure 9.) solutions that satisfy and
- Verify that is a solution to the given differential equation with the initial value Compare its graph to the one you sketched in (c).
- What is special about the solution where
Equilibrium solutions and stability
As our work in Activity demonstrates, first-order autonomous equations may have solutions that are constant. These are simple to detect by inspecting the differential equation constant solutions necessarily have a zero derivative, so
For example, in Activity , we considered the equation Constant solutions are found by setting which we immediately see implies that
Values of for which in an autonomous differential equation are called equilibrium solutions of the differential equation.
Activity
Consider the autonomous differential equation
- Make a plot of versus on the axes provided in Figure . Looking at the graph, for what values of does increase and for what values of does decrease?
Figure : Axes for plotting vs for
Figure : Axes for plotting the slope field for - Identify any equilibrium solutions of the given differential equation.
- Now sketch the slope field for the given differential equation on the axes provided in Figure .
- Sketch the solutions to the given differential equation that correspond to initial values
- An equilibrium solution is called stable if nearby solutions converge to This means that if the initial condition varies slightly from then Conversely, an equilibrium solution is called unstable if nearby solutions are pushed away from Using your work above, classify the equilibrium solutions you found in (b) as either stable or unstable.
- Suppose that describes the population of a species of living organisms and that the initial value is positive. What can you say about the eventual fate of this population?
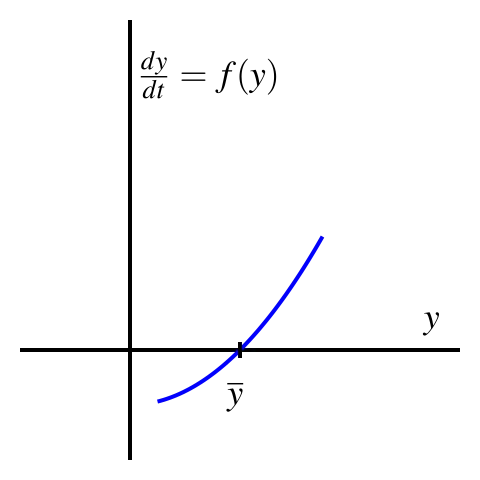
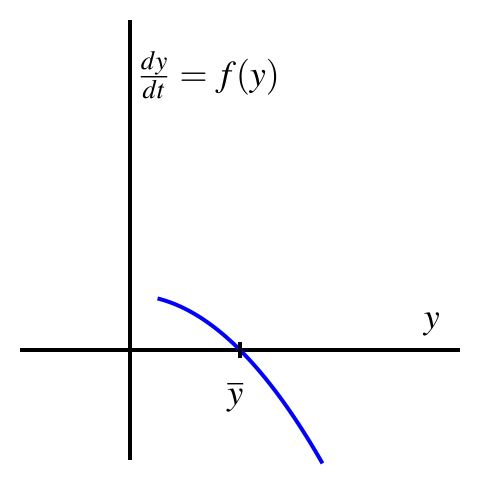
- Now consider a general autonomous differential equation of the form Remember that an equilibrium solution satisfies If we graph as a function of for which of the differential equations represented in Figure and Figure is a stable equilibrium and for which is unstable? Why?
Summary
- A slope field is a plot created by graphing the tangent lines of many different solutions to a differential equation.
- Once we have a slope field, we may sketch the graph of solutions by drawing a curve that is always tangent to the lines in the slope field.
- Autonomous differential equations sometimes have constant solutions that we call equilibrium solutions. These may be classified as stable or unstable, depending on the behavior of nearby solutions.