Motivating Questions
- How can we use a Riemann sum to estimate the area between a given curve and the horizontal axis over a particular interval?
- What are the differences among left, right, middle, and random Riemann sums?
- How can we write Riemann sums in an abbreviated form?
In Section 4.1, we learned that if an object moves with positive velocity the area between and the -axis over a given time interval tells us the distance traveled by the object over that time period. If is sometimes negative and we view the area of any region below the -axis as having an associated negative sign, then the sum of these signed areas tells us the moving object's change in position over a given time interval.
For instance, for the velocity function given in Figure , if the areas of shaded regions are and as labeled, then the total distance traveled by the moving object on is
while the total change in the object's position on is
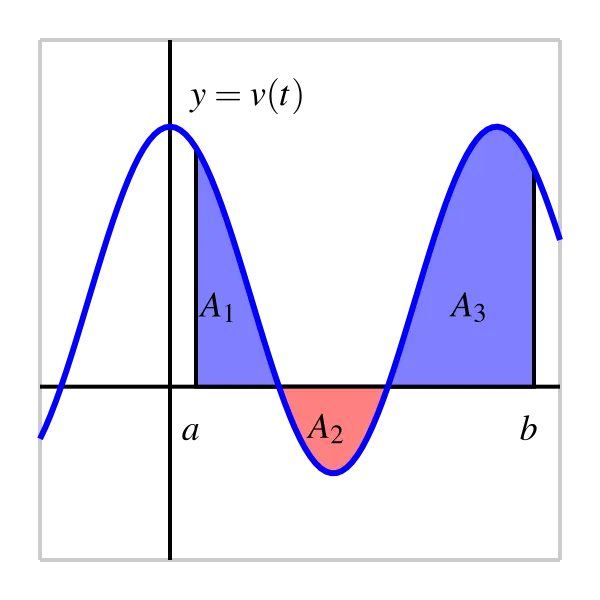
Because the motion is in the negative direction on the interval where we subtract to determine the object's total change in position.
Of course, finding and for the graph in Figure presumes that we can actually find the areas and So far, we have worked with velocity functions that were either constant or linear, so that the area bounded by the velocity function and the horizontal axis is a combination of rectangles and triangles, and we can find the area exactly. But when the curve bounds a region that is not a familiar geometric shape, we cannot find its area exactly. Indeed, this is one of our biggest goals in Chapter 4: to learn how to find the exact area bounded between a curve and the horizontal axis for as many different types of functions as possible.
In Activity 4.1.2, we approximated the area under a nonlinear velocity function using rectangles. In the following preview activity, we consider three different options for the heights of the rectangles we will use.
Preview Activity
A person walking along a straight path has her velocity in miles per hour at time given by the function for times in the interval The graph of this function is also given in each of the three diagrams in Figure .
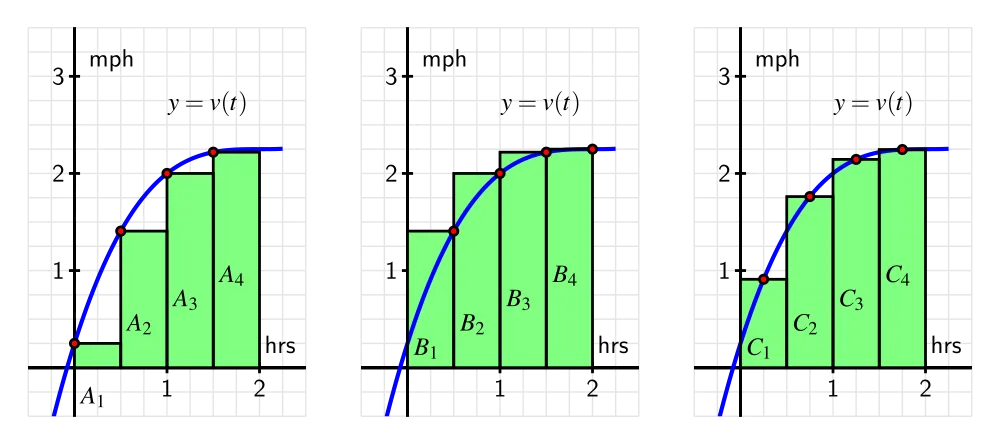
Note that in each diagram, we use four rectangles to estimate the area under on the interval but the method by which the four rectangles' respective heights are decided varies among the three individual graphs.
- How are the heights of rectangles in the left-most diagram being chosen? Explain, and hence determine the value of
by evaluating the function at appropriately chosen values and observing the width of each rectangle. Note, for example, that
- Explain how the heights of rectangles are being chosen in the middle diagram and find the value of
- Likewise, determine the pattern of how heights of rectangles are chosen in the right-most diagram and determine
- Of the estimates and which do you think is the best approximation of the total distance the person traveled on Why?
Sigma Notation
We have used sums of areas of rectangles to approximate the area under a curve. Intuitively, we expect that using a larger number of thinner rectangles will provide a better estimate for the area. Consequently, we anticipate dealing with sums of a large number of terms. To do so, we introduce sigma notation, named for the Greek letter which is the capital letter in the Greek alphabet.
For example, say we are interested in the sum
the sum of the first 100 natural numbers. In sigma notation we write
We read the symbol as “the sum from equals 1 to 100 of ” The variable is called the index of summation, and any letter can be used for this variable. The pattern in the terms of the sum is denoted by a function of the index; for example,
and more generally,
Sigma notation allows us to vary easily the function being used to describe the terms in the sum, and to adjust the number of terms in the sum simply by changing the value of We test our understanding of this new notation in the following activity.
Activity
For each sum written in sigma notation, write the sum long-hand and evaluate the sum to find its value. For each sum written in expanded form, write the sum in sigma notation.
When a moving body has a positive velocity function on a given interval the area under the curve over the interval gives the total distance the body travels on We are also interested in finding the exact area bounded by on an interval regardless of the meaning or context of the function For now, we continue to focus on finding an accurate estimate of this area by using a sum of the areas of rectangles. Unless otherwise indicated, we assume that is continuous and non-negative on
The first choice we make in such an approximation is the number of rectangles.
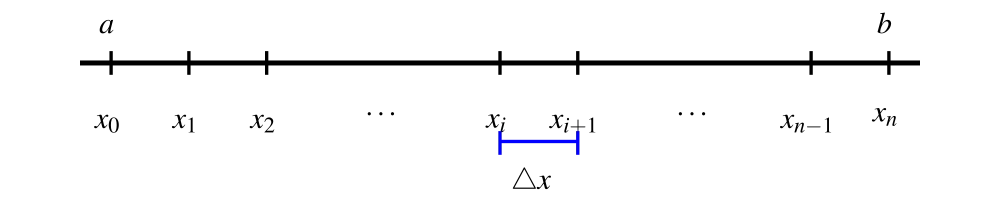
If we desire rectangles of equal width to subdivide the interval then each rectangle must have width We let and define so that and so on, as pictured in Figure 3.
We use each subinterval as the base of a rectangle, and next choose the height of the rectangle on that subinterval. There are three standard choices: we can use the left endpoint of each subinterval, the right endpoint of each subinterval, or the midpoint of each. These are precisely the options encountered in Preview Activity 1 and seen in Figure 2. We next explore how these choices can be described in sigma notation.
Consider an arbitrary positive function on with the interval subdivided as shown in Figure 3, and choose to use left endpoints. Then on each interval the area of the rectangle formed is given by
as seen in Figure .
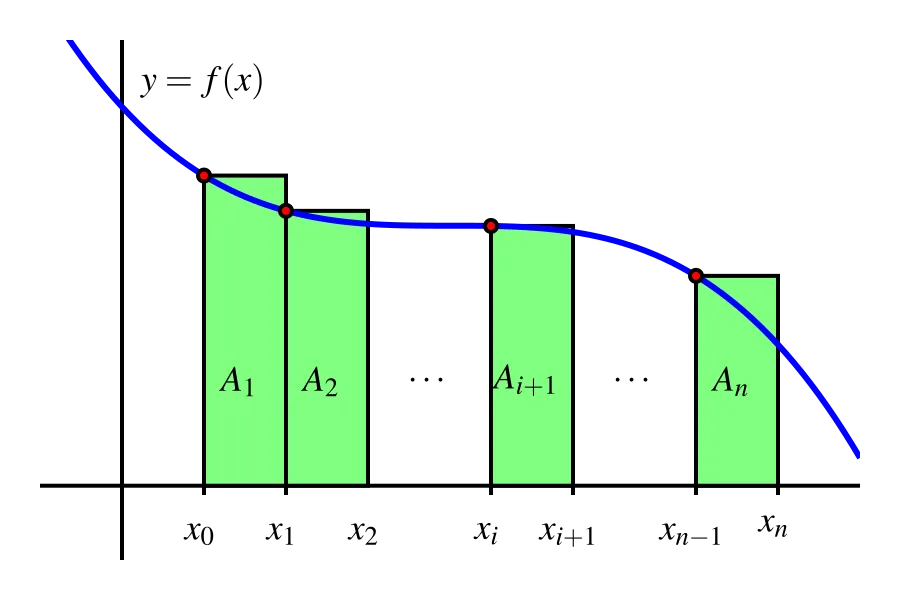
If we let denote the sum of the areas of these rectangles, we see that
In the more compact sigma notation, we have
Note that since the index of summation begins at and ends at there are indeed terms in this sum. We call the left Riemann sum for the function on the interval
To see how the Riemann sums for right endpoints and midpoints are constructed, we consider Figure .
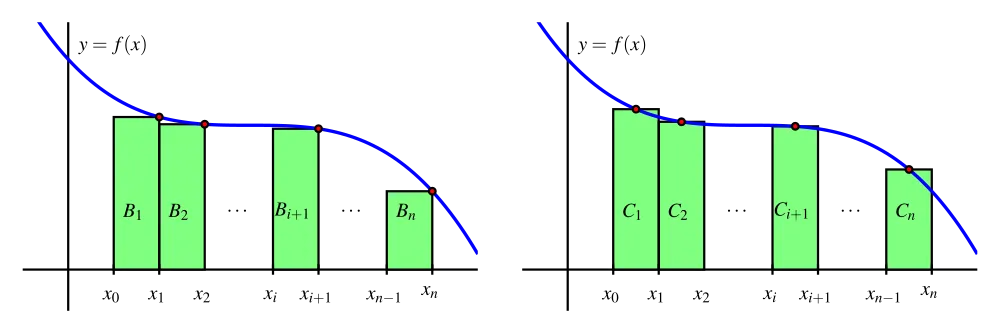
For the sum with right endpoints, we see that the area of the rectangle on an arbitrary interval is given by and that the sum of all such areas of rectangles is given by
We call the right Riemann sum for the function on the interval
For the sum that uses midpoints, we introduce the notation
so that is the midpoint of the interval For instance, for the rectangle with area in Figure 5, we now have
Hence, the sum of all the areas of rectangles that use midpoints is
and we say that is the middle Riemann sum for on
Thus, we have two variables to explore: the number of rectangles and the height of each rectangle. We can explore these choices dynamically, and the applet 1 found at http://gvsu.edu/s/a9 is a particularly useful one. There we see the image shown in Figure , but with the opportunity to adjust the slider bars for the heights and the number of rectangles.
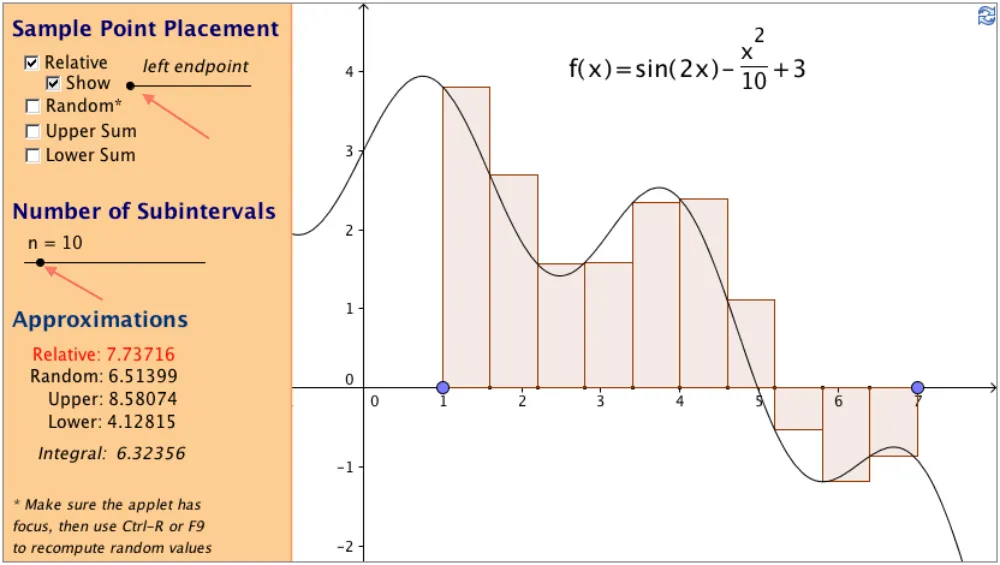
By moving the sliders, we can see how the heights of the rectangles change as we consider left endpoints, midpoints, and right endpoints, as well as the impact that a larger number of narrower rectangles has on the approximation of the exact area bounded by the function and the horizontal axis.
When on each of the Riemann sums and provides an estimate of the area under the curve over the interval We also recall that in the context of a nonnegative velocity function the corresponding Riemann sums approximate the distance traveled on by a moving object with velocity function
There is a more general way to think of Riemann sums, and that is to allow any choice of where the function is evaluated to determine the rectangle heights. Rather than saying we'll always choose left endpoints, or always choose midpoints, we simply say that a point will be selected at random in the interval (so that ). The Riemann sum is then given by
At http://gvsu.edu/s/a9, the applet noted earlier and referenced in Figure , by unchecking the “relative” box at the top left, and instead checking “random,” we can easily explore the effect of using random point locations in subintervals on a Riemann sum. In computational practice, we most often use or while the random Riemann sum is useful in theoretical discussions. In the following activity, we investigate several different Riemann sums for a particular velocity function.
Activity
Suppose that an object moving along a straight line path has its velocity in feet per second at time in seconds given by
- Carefully sketch the region whose exact area will tell you the value of the distance the object traveled on the time interval
- Estimate the distance traveled on by computing and
- Does averaging and result in the same value as If not, what do you think the average of and measures?
- For this question, think about an arbitrary function rather than the particular function given above. If is positive and increasing on will over-estimate or under-estimate the exact area under on Will over- or under-estimate the exact area under on Explain.
When the function is sometimes negative
For a Riemann sum such as
we can of course compute the sum even when takes on negative values. We know that when is positive on a Riemann sum estimates the area bounded between and the horizontal axis over the interval.
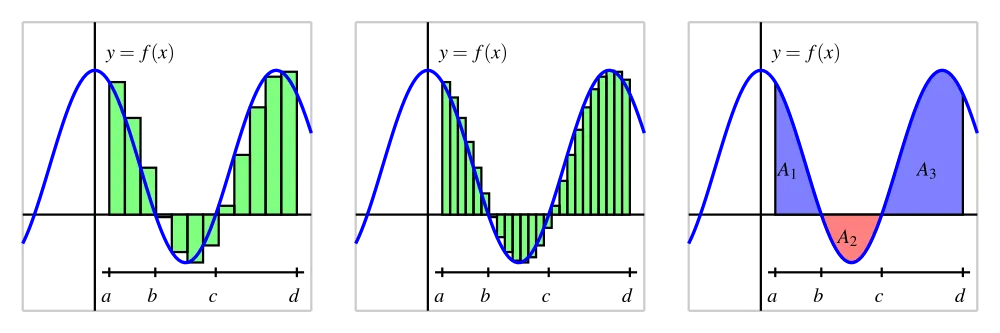
For the function pictured in the first graph of Figure , a left Riemann sum with 12 subintervals over is shown. The function is negative on the interval so at the four left endpoints that fall in the terms are negative. This means that those four terms in the Riemann sum produce an estimate of the opposite of the area bounded by and the -axis on
In the middle graph of Figure , we see that by increasing the number of rectangles the approximation of the area (or the opposite of the area) bounded by the curve appears to improve.
In general, any Riemann sum of a continuous function on an interval approximates the difference between the area that lies above the horizontal axis on and under and the area that lies below the horizontal axis on and above In the notation of Figure , we may say that
where is the left Riemann sum using 24 subintervals shown in the middle graph. and are the areas of the regions where is positive, and is the area where is negative. We will call the quantity the net signed area bounded by over the interval where by the phrase “signed area” we indicate that we are attaching a minus sign to the areas of regions that fall below the horizontal axis.
Finally, we recall that if the function represents the velocity of a moving object, the sum of the areas bounded by the curve tells us the total distance traveled over the relevant time interval, while the net signed area bounded by the curve computes the object's change in position on the interval.
Activity
Suppose that an object moving along a straight line path has its velocity (in feet per second) at time (in seconds) given by
- Compute the middle Riemann sum, for on the time interval Be sure to clearly identify the value of as well as the locations of In addition, provide a careful sketch of the function and the corresponding rectangles that are being used in the sum.
- Building on your work in (a), estimate the total change in position of the object on the interval
- Building on your work in (a) and (b), estimate the total distance traveled by the object on
- Use appropriate computing technology 2 to compute and What exact value do you think the middle sum eventually approaches as increases without bound? What does that number represent in the physical context of the overall problem?
For instance, consider the applet at http://gvsu.edu/s/a9 and change the function and adjust the locations of the blue points that represent the interval endpoints and
Summary
- A Riemann sum is simply a sum of products of the form that estimates the area between a positive function and the horizontal axis over a given interval. If the function is sometimes negative on the interval, the Riemann sum estimates the difference between the areas that lie above the horizontal axis and those that lie below the axis.
- The three most common types of Riemann sums are left, right, and middle sums, but we can also work with a more general Riemann sum. The only difference among these sums is the location of the point at which the function is evaluated to determine the height of the rectangle whose area is being computed. For a left Riemann sum, we evaluate the function at the left endpoint of each subinterval, while for right and middle sums, we use right endpoints and midpoints, respectively.
- The left, right, and middle Riemann sums are denoted and with formulas
where and using For the midpoint sum,