Motivating Questions
- In contexts other than the position of a moving object, what does the derivative of a function measure?
- What are the units on the derivative function and how are they related to the units of the original function
- What is a central difference, and how can one be used to estimate the value of the derivative at a point from given function data?
- Given the value of the derivative of a function at a point, what can we infer about how the value of the function changes nearby?
It is a powerful feature of mathematics that it can be studied both as abstract discipline and as an applied one. For instance, calculus can be developed almost entirely as an abstract collection of ideas that focus on properties of functions. At the same time, if we consider functions that represent meaningful processes, calculus can describe our experience of physical reality. We have already seen that for the position function of a ball being tossed straight up in the air, the derivative of the position function, gives the ball's velocity at time
In this section, we investigate several functions with specific physical meaning, and consider how the units on the independent variable, dependent variable, and the derivative function add to our understanding. To start, we consider the familiar problem of a position function of a moving object.
Preview Activity
One of the longest stretches of straight (and flat) road in North America can be found on the Great Plains in the state of North Dakota on state highway 46, which lies just south of the interstate highway I-94 and runs through the town of Gackle. A car leaves town (at time ) and heads east on highway 46; its position in miles from Gackle at time in minutes is given by the graph of the function in Figure . Three important points are labeled on the graph; where the curve looks linear, assume that it is indeed a straight line.
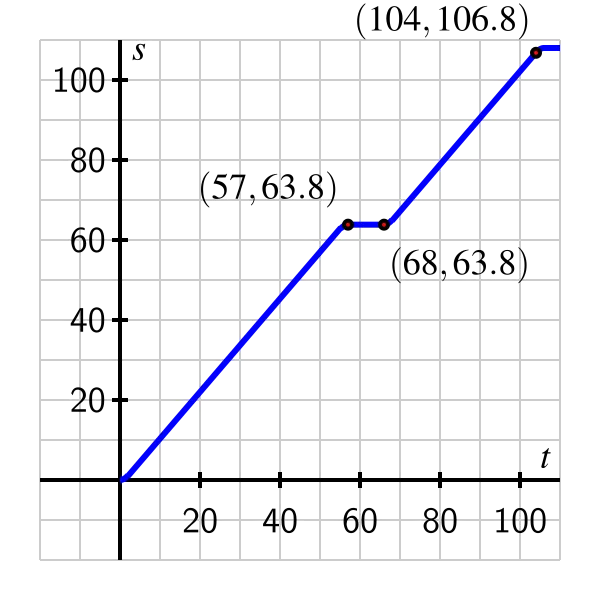
- In everyday language, describe the behavior of the car over the provided time interval. In particular, discuss what is happening on the time intervals and
- Find the slope of the line between the points and What are the units on this slope? What does the slope represent?
- Find the average rate of change of the car's position on the interval Include units on your answer.
- Estimate the instantaneous rate of change of the car's position at the moment Write a sentence to explain your reasoning and the meaning of this value.
Units of the derivative function
As we now know, the derivative of the function at a fixed value is given by
and this value has several different interpretations. If we set one meaning of is the slope of the tangent line at the point
We also sometimes write or instead of and these alternate notations help us see the units (and thus the meaning) of the derivative as the instantaneous rate of change of with respect to . The units on the slope of the secant line, are “units of per unit of ” and when we take the limit as goes to zero, the derivative has the same units: units of per unit of It is helpful to remember that the units on the derivative function are “units of output per unit of input,” for the variables of the original function.
For example, suppose that the function measures the population of a city (in thousands) at the start of year (where corresponds to 2010 AD). We are told that What is the meaning of this value? Well, since is measured in thousands and is measured in years, we can say that the instantaneous rate of change of the city's population with respect to time at the start of 2012 is 21.37 thousand people per year. We therefore expect that in the coming year, about 21,370 people will be added to the city's population.
Toward more accurate derivative estimates
Recall that to estimate the value of at a given we calculate a difference quotient with a relatively small value of We should use both positive and negative values of in order to account for the behavior of the function on both sides of the point of interest. To that end, we introduce the notion of a central difference and its role in estimating derivatives.
Example
Suppose that is a function for which three values are known: and Estimate
- Answer
-
We know that But since we don't have a graph or a formula for the function, we can neither sketch a tangent line nor evaluate the limit algebraically. We can't even use smaller and smaller values of to estimate the limit. Instead, we have just two choices: using or depending on which point we pair with
So, one estimate is
The other is
Because the first approximation looks backward from the point and the second approximation looks forward, it makes sense to average these two estimates in order to account for behavior on both sides of Doing so, we find that
The intuitive approach to average the two estimates found in Example is in fact the best possible way estimate to a derivative when we have just two function values for on opposite sides of the point of interest.
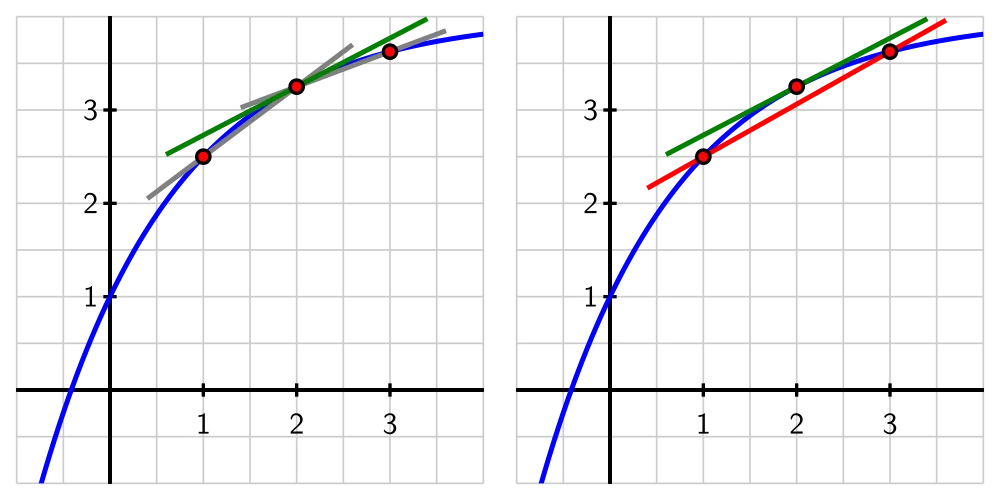
To see why, we think about the diagram in Figure . On the left, we see the two secant lines with slopes that come from computing the backward difference and from the forward difference Note how the first slope over-estimates the slope of the tangent line at while the second slope underestimates On the right, we see the secant line whose slope is given by the central difference
Note that this central difference has the same value as the average of the forward and backward differences (and it is straightforward to explain why this always holds). The central difference yields a very good approximation to the derivative's value, because it yields a line closer to being parallel to the tangent line.
The central difference approximation to the value of the first derivative is given by
This quantity measures the slope of the secant line to through the points and
Activity
A potato is placed in an oven, and the potato's temperature (in degrees Fahrenheit) at various points in time is taken and recorded in the following table. Time is measured in minutes.
- Use a central difference to estimate the instantaneous rate of change of the temperature of the potato at Include units on your answer.
- Use a central difference to estimate the instantaneous rate of change of the temperature of the potato at Include units on your answer.
- Without doing any calculation, which do you expect to be greater: or Why?
- Suppose it is given that and What are the units on these two quantities? What do you expect the temperature of the potato to be when when Why?
- Write a couple of careful sentences that describe the behavior of the temperature of the potato on the time interval as well as the behavior of the instantaneous rate of change of the temperature of the potato on the same time interval.
Activity
A company manufactures rope, and the total cost of producing feet of rope is dollars.
- What does it mean to say that
- What are the units of
- Suppose that and Estimate and justify your estimate by writing at least one sentence that explains your thinking.
- Do you think is less than, equal to, or greater than Why?
- Suppose someone claims that What would the practical meaning of this derivative value tell you about the approximate cost of the next foot of rope? Is this possible? Why or why not?
Activity
Researchers at a major car company have found a function that relates gasoline consumption to speed for a particular model of car. In particular, they have determined that the consumption in liters per kilometer, at a given speed is given by a function where is the car's speed in kilometers per hour.
- Data provided by the car company tells us that and Use this information to estimate the instantaneous rate of change of fuel consumption with respect to speed at Be as accurate as possible, use proper notation, and include units on your answer.
- By writing a complete sentence, interpret the meaning (in the context of fuel consumption) of “”
- Write at least one complete sentence that interprets the meaning of the value of that you estimated in (a).
In Section 1.4, we learned how use to the graph of a given function to plot the graph of its derivative, It is important to remember that when we do so, the scale and the units on the vertical axis often have to change to represent For example, suppose that tells us the temperature in degrees Fahrenheit of a potato in an oven at time in minutes. In Figure , we sketch the graph of on the left and the graph of on the right.
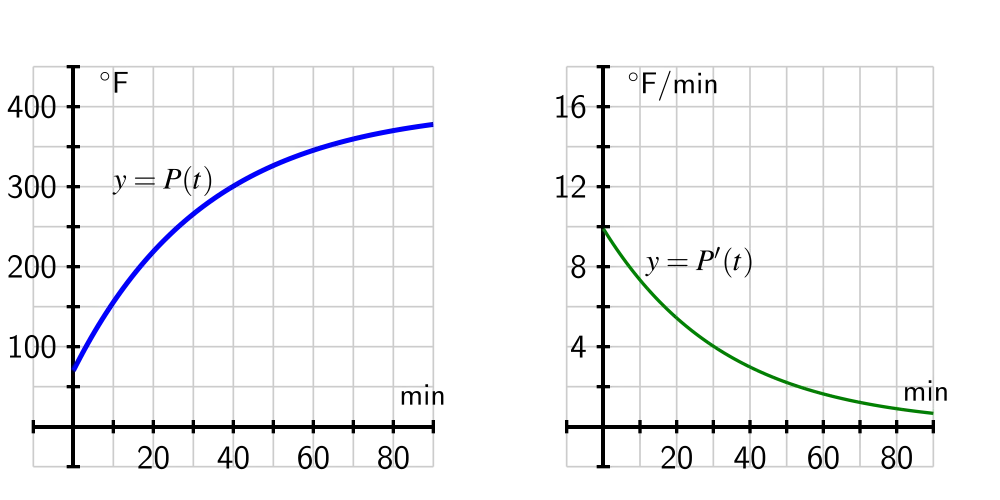
Notice that the vertical scales are different in size and different in units, as the units of are F, while those of are F/min.
Summary
- The derivative of a given function measures the instantaneous rate of change of the output variable with respect to the input variable.
- The units on the derivative function are units of per unit of Again, this measures how fast the output of the function changes when the input of the function changes.
- The central difference approximation to the value of the first derivative is given by
This quantity measures the slope of the secant line to through the points and The central difference generates a good approximation of the derivative's value.