1.1: How do we Measure Velocity?
1. Average velocity from position
2. Rate of calorie consumption
3. Average rate of change - quadratic function
4. Comparing average rate of change of two functions
5. Matching a distance graph to velocity
6
A bungee jumper dives from a tower at time Her height (measured in feet) at time (in seconds) is given by the graph in Figure 1.1.4. In this problem, you may base your answers on estimates from the graph or use the fact that the jumper's height function is given by
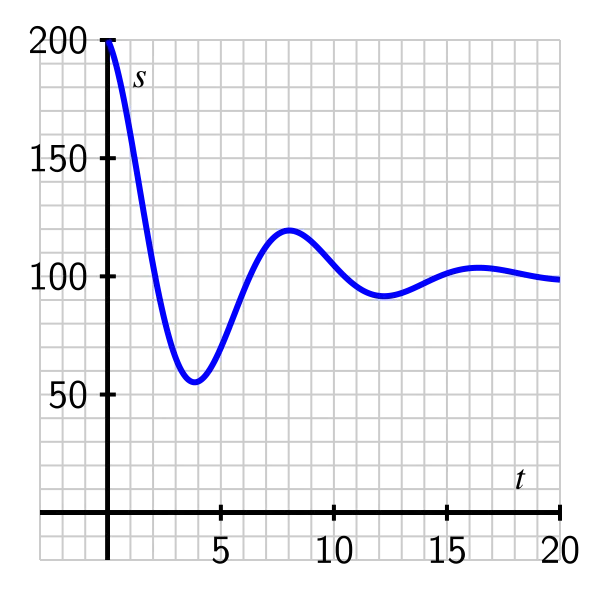
- What is the change in vertical position of the bungee jumper between and
- Estimate the jumper's average velocity on each of the following time intervals: and Include units on your answers.
- On what time interval(s) do you think the bungee jumper achieves her greatest average velocity? Why?
- Estimate the jumper's instantaneous velocity at Show your work and explain your reasoning, and include units on your answer.
- Among the average and instantaneous velocities you computed in earlier questions, which are positive and which are negative? What does negative velocity indicate?
7
A diver leaps from a 3 meter springboard. His feet leave the board at time he reaches his maximum height of 4.5 m at seconds, and enters the water at Once in the water, the diver coasts to the bottom of the pool (depth 3.5 m), touches bottom at rests for one second, and then pushes off the bottom. From there he coasts to the surface, and takes his first breath at
- a. Let denote the function that gives the height of the diver's feet (in meters) above the water at time (Note that the “height” of the bottom of the pool is meters.) Sketch a carefully labeled graph of on the provided axes in Figure 1.1.5. Include scale and units on the vertical axis. Be as detailed as possible.
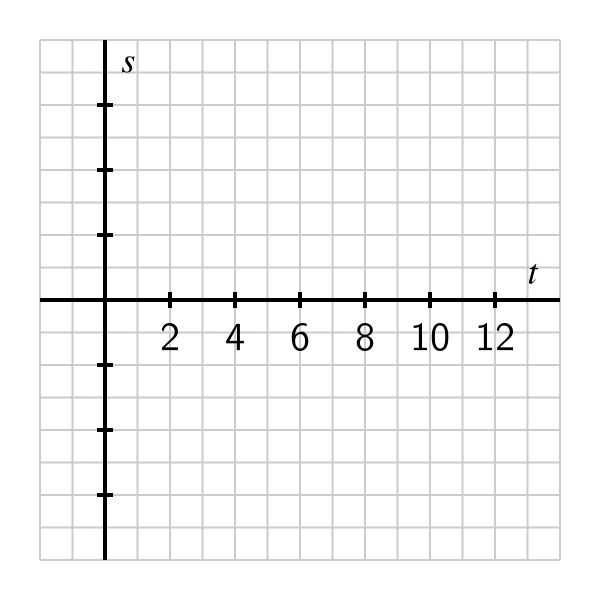
- Based on your graph in (a), what is the average velocity of the diver between and Is his average velocity the same on every time interval within
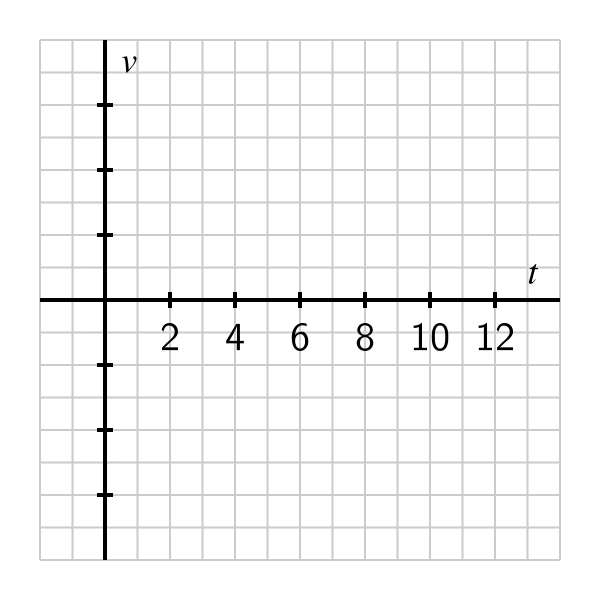
- Let the function represent the instantaneous vertical velocity of the diver at time (i.e. the speed at which the height function is changing; note that velocity in the upward direction is positive, while the velocity of a falling object is negative). Based on your understanding of the diver's behavior, as well as your graph of the position function, sketch a carefully labeled graph of on the axes provided in Figure 1.1.6. Include scale and units on the vertical axis. Write several sentences that explain how you constructed your graph, discussing when you expect to be zero, positive, negative, relatively large, and relatively small.
- Is there a connection between the two graphs that you can describe? What can you say about the velocity graph when the height function is increasing? decreasing? Make as many observations as you can.
8
According to the U.S. census, the population of the city of Grand Rapids, MI, was 181,843 in 1980; 189,126 in 1990; and 197,800 in 2000.
- Between 1980 and 2000, by how many people did the population of Grand Rapids grow?
- In an average year between 1980 and 2000, by how many people did the population of Grand Rapids grow?
- Just like we can find the average velocity of a moving body by computing change in position over change in time, we can compute the average rate of change of any function In particular, the average rate of change of a function over an interval is the quotient What does the quantity measure on the graph of over the interval
- Let represent the population of Grand Rapids at time where is measured in years from January 1, 1980. What is the average rate of change of on the interval to What are the units on this quantity?
- If we assume the population of Grand Rapids is growing at a rate of approximately 4% per decade, we can model the population function with the formula Use this formula to compute the average rate of change of the population on the intervals and
- How fast do you think the population of Grand Rapids was changing on January 1, 1985? Said differently, at what rate do you think people were being added to the population of Grand Rapids as of January 1, 1985? How many additional people should the city have expected in the following year? Why?
1.2: The Notion of Limit
Exercise 1: Limits on a piecewise graph
Exercise 2: Estimating a limit numerically
Exercise 3: Limits for a piecewise formula
Exercise 4: Evaluating a limit algebraically
Exercise 5
Consider the function whose formula is
- What is the domain of
- Use a sequence of values of near to estimate the value of if you think the limit exists. If you think the limit doesn't exist, explain why.
- Use algebra to simplify the expression and hence work to evaluate exactly, if it exists, or to explain how your work shows the limit fails to exist. Discuss how your findings compare to your results in (b).
- True or false: Why?
- True or false: Why? How is this equality connected to your work above with the function
- Based on all of your work above, construct an accurate, labeled graph of on the interval and write a sentence that explains what you now know about
Exercise 6
Let
- What is the domain of
- Use a sequence of values near to estimate the value of if you think the limit exists. If you think the limit doesn't exist, explain why.
- Use algebra to simplify the expression and hence work to evaluate exactly, if it exists, or to explain how your work shows the limit fails to exist. Discuss how your findings compare to your results in (b). (Hint: whenever but whenever )
- True or false: Why?
- True or false: Why? How is this equality connected to your work above with the function
- Based on all of your work above, construct an accurate, labeled graph of on the interval and write a sentence that explains what you now know about
Exercise 7
For each of the following prompts, sketch a graph on the provided axes of a function that has the stated properties.
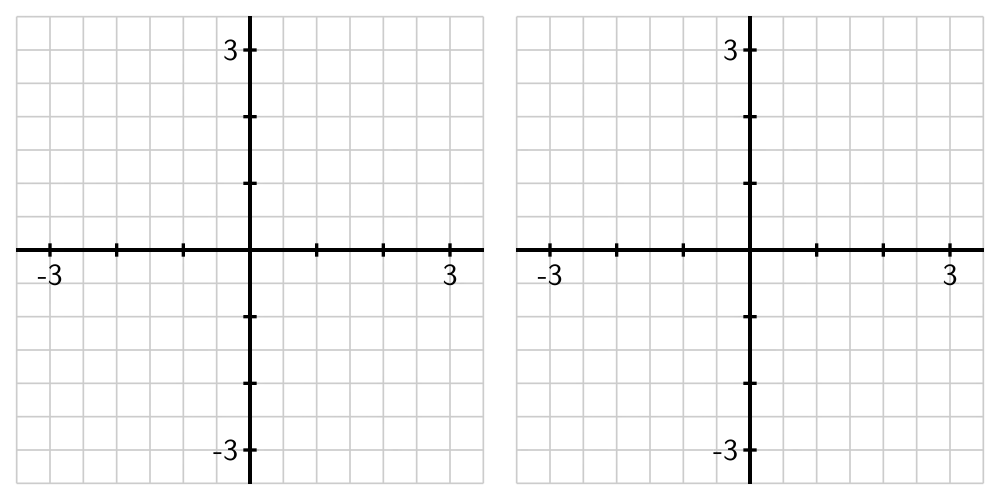
- such that
- and
- and
- is not defined and
- and does not exist.
- such that
- and
- At and has a limit, and its limit equals the value of the function at that point.
- is not defined and does not exist.
Exercise 8
A bungee jumper dives from a tower at time Her height in feet at time in seconds is given by
- Write an expression for the average velocity of the bungee jumper on the interval
- Use computing technology to estimate the value of the limit as of the quantity you found in (a).
- What is the meaning of the value of the limit in (b)? What are its units?
1.3: The Derivative of a Function at a Point
1. Estimating derivative values graphically
2. Tangent line to a curve
3. Interpreting values and slopes from a graph
4. Finding an exact derivative value algebraically
5. Estimating a derivative from the limit definition
6.
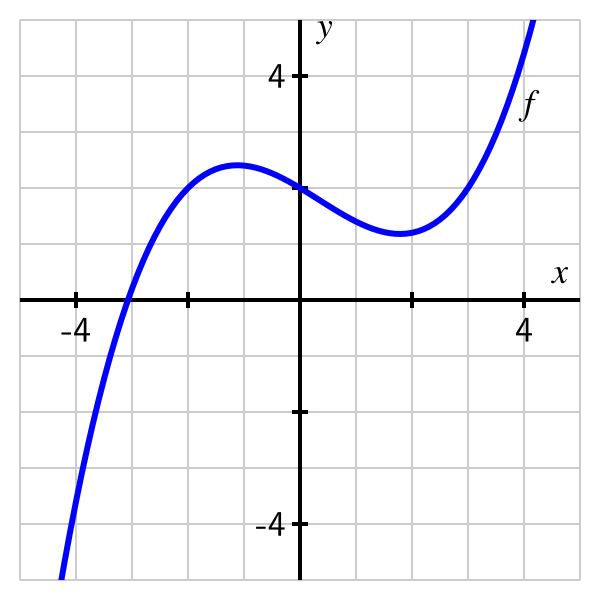
Consider the graph of provided in Figure 1.3.12.
- On the graph of sketch and label the following quantities:
- the secant line to on the interval and the secant line to on the interval
- the tangent line to at and the tangent line to at
- What is the approximate value of the average rate of change of on On How are these values related to your work in (a)?
- What is the approximate value of the instantaneous rate of change of at At How are these values related to your work in (a)?
7.
For each of the following prompts, sketch a graph on the provided axes in Figure 1.3.13 of a function that has the stated properties.
- such that
- the average rate of change of on is and the average rate of change of on is 0.5, and
- the instantaneous rate of change of at is and the instantaneous rate of change of at is 1.
- such that
- and and
- and
8.
Suppose that the population, of China (in billions) can be approximated by the function where is the number of years since the start of 1993.
- According to the model, what was the total change in the population of China between January 1, 1993 and January 1, 2000? What will be the average rate of change of the population over this time period? Is this average rate of change greater or less than the instantaneous rate of change of the population on January 1, 2000? Explain and justify, being sure to include proper units on all your answers.
- According to the model, what is the average rate of change of the population of China in the ten-year period starting on January 1, 2012?
- Write an expression involving limits that, if evaluated, would give the exact instantaneous rate of change of the population on today's date. Then estimate the value of this limit (discuss how you chose to do so) and explain the meaning (including units) of the value you have found.
- Find an equation for the tangent line to the function at the point where the -value is given by today's date.
9.
The goal of this problem is to compute the value of the derivative at a point for several different functions, where for each one we do so in three different ways, and then to compare the results to see that each produces the same value.
For each of the following functions, use the limit definition of the derivative to compute the value of using three different approaches: strive to use the algebraic approach first (to compute the limit exactly), then test your result using numerical evidence (with small values of ), and finally plot the graph of near along with the appropriate tangent line to estimate the value of visually. Compare your findings among all three approaches; if you are unable to complete the algebraic approach, still work numerically and graphically.
1.4: The Derivative Function
1. The derivative function graphically
2. Applying the limit definition of the derivative
3. Sketching the derivative
4. Comparing function and derivative values
5. Limit definition of the derivative for a rational function
6
Let be a function with the following properties: is differentiable at every value of (that is, has a derivative at every point), and and
a. On the axes provided at left in Figure 1.4.3, sketch a possible graph of Explain why your graph meets the stated criteria.
b. Conjecture a formula for the function Use the limit definition of the derivative to determine the corresponding formula for Discuss both graphical and algebraic evidence for whether or not your conjecture is correct.
7.
Consider the function
- Use the limit definition of the derivative to determine a formula for
- Use a graphing utility to plot both and your result for does your formula for generate the graph you expected?
- Use the limit definition of the derivative to find a formula for where
- Compare and contrast the formulas for and you have found. How do the constants 5, 4, 12, and 3 affect the results?
8.
Let be a continuous function (that is, one with no jumps or holes in the graph) and suppose that a graph of is given by the graph on the right in Figure 1.4.4.
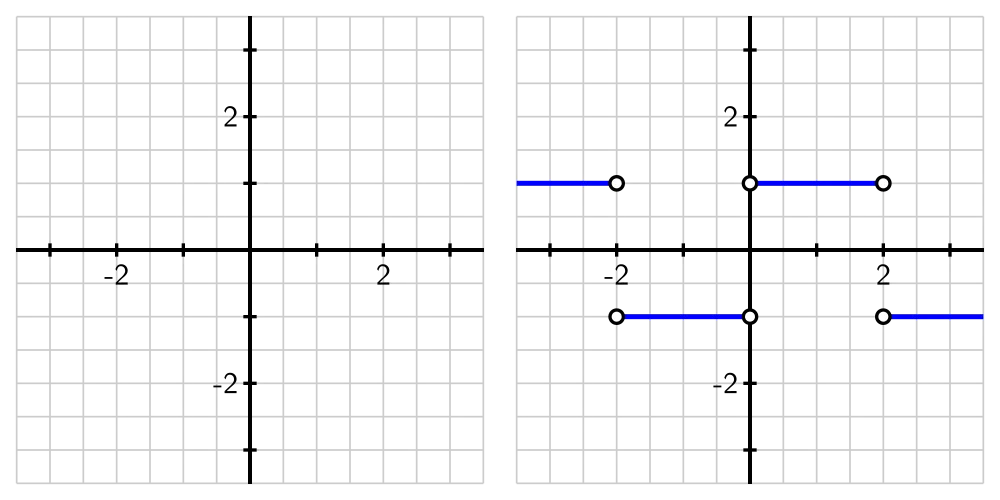
- Observe that for every value of that satisfies the value of is constant. What does this tell you about the behavior of the graph of on this interval?
- On what intervals other than do you expect to be a linear function? Why?
- At which values of is not defined? What behavior does this lead you to expect to see in the graph of
- Suppose that On the axes provided at left in Figure 1.4.4, sketch an accurate graph of
9
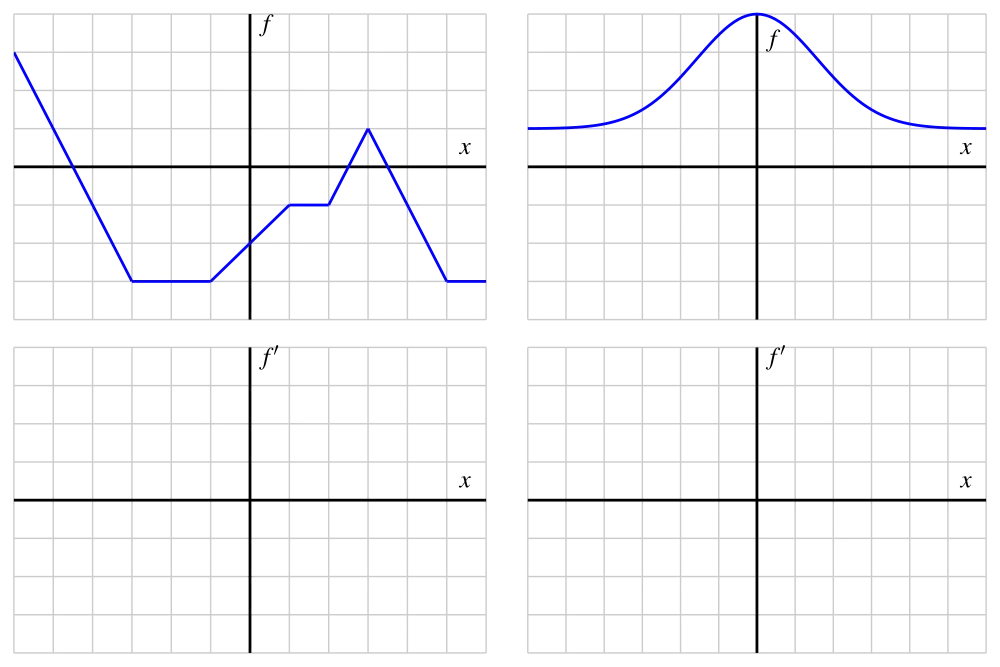
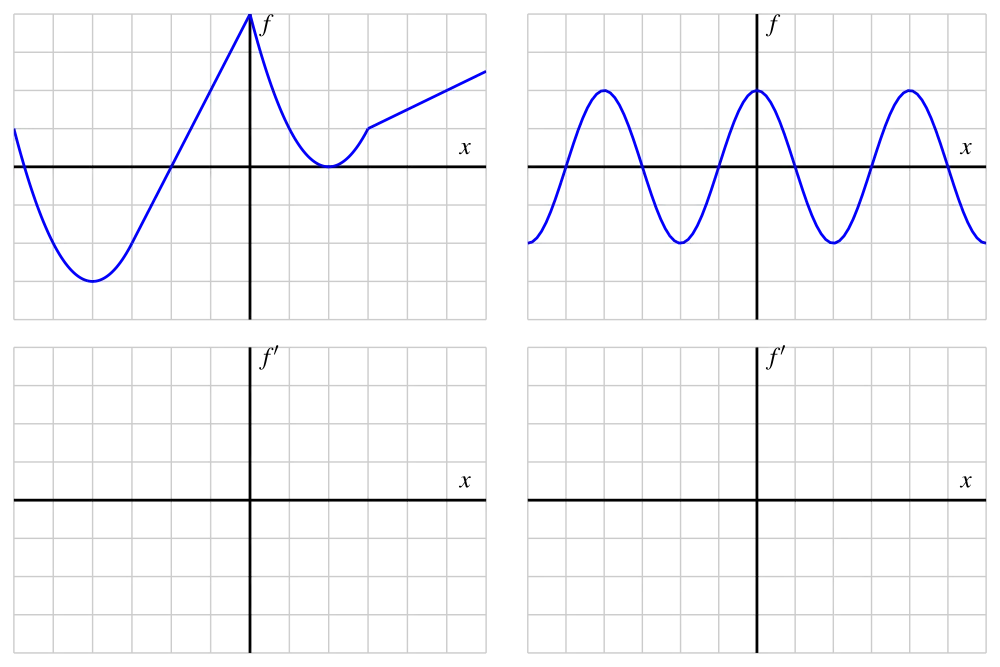
For each graph that provides an original function in Figure 1.4.5, your task is to sketch an approximate graph of its derivative function, on the axes immediately below. View the scale of the grid for the graph of as being and assume the horizontal scale of the grid for the graph of is identical to that for If you need to adjust the vertical scale on the axes for the graph of you should label that accordingly.
1.5: Interpretating, Estimating, and Using the Derivative
1. A cooling cup of coffee
2. A cost function
3. Weight as a function of calories
4. Displacement and velocity
5
A cup of coffee has its temperature (in degrees Fahrenheit) at time given by the function where time is measured in minutes.
- Use a central difference with to estimate the value of
- What are the units on the value of that you computed in (a)? What is the practical meaning of the value of
- Which do you expect to be greater: or Why?
- Write a sentence that describes the behavior of the function on the time interval How do you think its graph will look? Why?
6.
The temperature change (in Fahrenheit degrees), in a patient, that is generated by a dose (in milliliters), of a drug, is given by the function
- What does it mean to say Write a complete sentence to explain, using correct units.
- A person's sensitivity, to the drug is defined by the function What are the units of sensitivity?
- Suppose that Write a complete sentence to explain the meaning of this value. Include in your response the information given in (a).
7.
The velocity of a ball that has been tossed vertically in the air is given by where is measured in feet per second, and is measured in seconds. The ball is in the air from until
- When is the ball's velocity greatest?
- Determine the value of Justify your thinking.
- What are the units on the value of What does this value and the corresponding units tell you about the behavior of the ball at time
- What is the physical meaning of the function
8.
The value, of a particular automobile (in dollars) depends on the number of miles, the car has been driven, according to the function
- Suppose that and What is the average rate of change of on the interval and what are the units on this value?
- In addition to the information given in (a), say that Determine the best possible estimate of and write one sentence to explain the meaning of your result, including units on your answer.
- Which value do you expect to be greater: or Why?
- Write a sentence to describe the long-term behavior of the function plus another sentence to describe the long-term behavior of Provide your discussion in practical terms regarding the value of the car and the rate at which that value is changing.
1.6: The Second Derivative
1. Comparing values
2. Signs of values
3. Acceleration from velocity
4. Rates of change of stock values
5. Interpreting a graph of
6
Suppose that is a twice-differentiable function such that is continuous for which the following information is known:
- Is increasing or decreasing near Is concave up or concave down near
- Do you expect to be greater than equal to or less than Why?
- Do you expect to be greater than equal to or less than Why?
- Sketch a graph of near and include a graph of the tangent line.
7.
For a certain function its derivative is given by the function pictured in Figure 1.6.15.
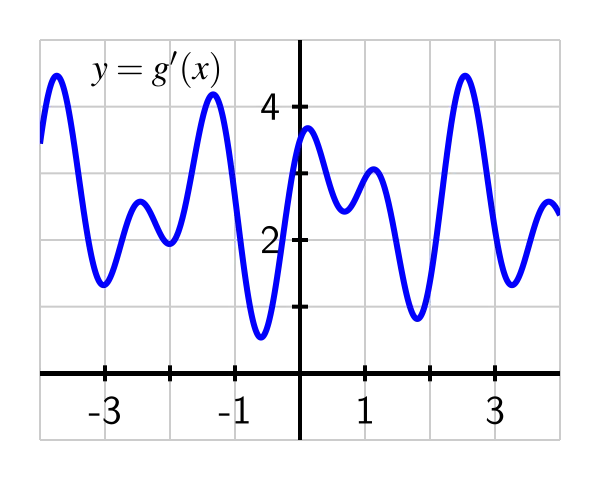
- What is the approximate slope of the tangent line to at the point
- How many real number solutions can there be to the equation Justify your conclusion fully and carefully by explaining what you know about how the graph of must behave based on the given graph of
- On the interval how many times does the concavity of change? Why?
- Use the provided graph to estimate the value of
8
A bungee jumper's height (in feet ) at time (in seconds) is given in part by the table:
- Use the given data to estimate and At which of these times is the bungee jumper rising most rapidly?
- Use the given data and your work in (a) to estimate
- What physical property of the bungee jumper does the value of measure? What are its units?
- Based on the data, on what approximate time intervals is the function concave down? What is happening to the velocity of the bungee jumper on these time intervals?
9
For each prompt that follows, sketch a possible graph of a function on the interval that satisfies the stated properties.
- such that is increasing on concave up on and concave down on
- such that is increasing on concave down on and concave up on
- such that is decreasing on concave up on neither concave up nor concave down on and concave down on
- such that is decreasing and concave down on and is increasing and concave down on
1.7: Limits, Continuity, and Differentiability
1. Limit values of a piecewise graph
2. Limit values of a piecewise formula
3. Continuity and differentiability of a graph
4. Continuity of a piecewise formula
5.
Consider the graph of the function that is provided in Figure 1.7.10. Assume that each portion of the graph of is a straight line, as pictured.
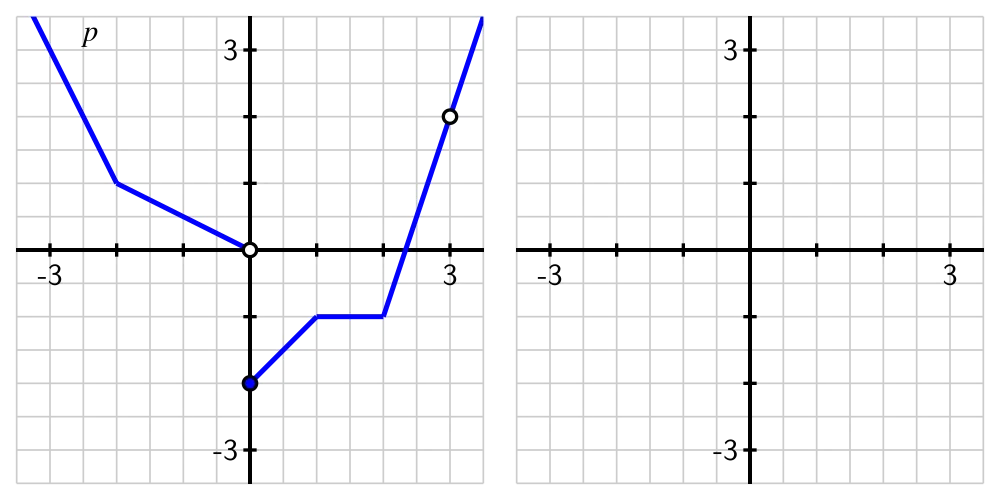
- State all values of for which does not exist.
- State all values of for which is not continuous at
- State all values of for which is not differentiable at
- On the axes provided in Figure 1.7.10, sketch an accurate graph of
6.
For each of the following prompts, give an example of a function that satisfies the stated criteria. A formula or a graph, with reasoning, is sufficient for each. If no such example is possible, explain why.
- A function that is continuous at but not differentiable at
- A function that is differentiable at but does not have a limit at
- A function that has a limit at is defined at but is not continuous at
- A function that satisfies all of the following:
- and
- and
- and does not exist
7.
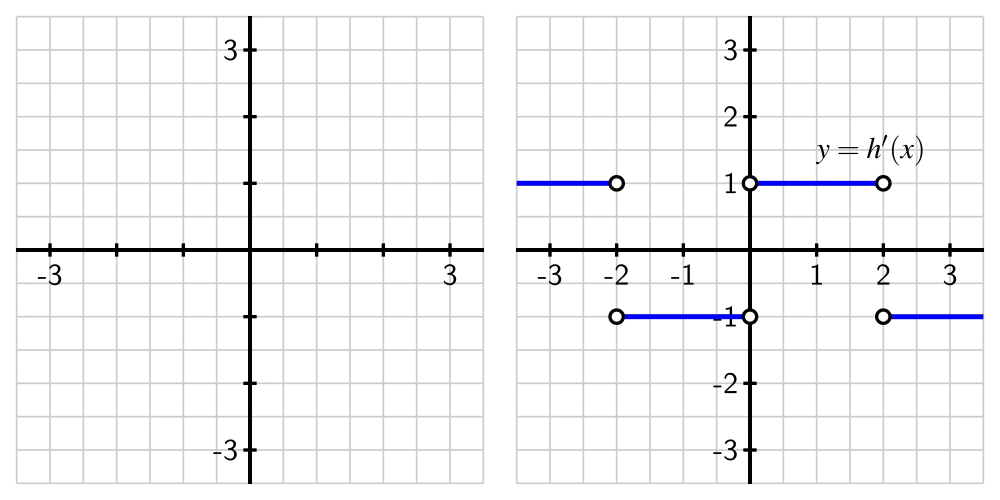
Let be a function whose derivative is given by the graph on the right in Figure 1.7.11.
- Based on the graph of what can you say about the behavior of the function
- At which values of is not defined? What behavior does this lead you to expect to see in the graph of
- Is it possible for to have points where is not continuous? Explain your answer.
- On the axes provided at left, sketch at least two distinct graphs that are possible functions that each have a derivative that matches the provided graph at right. Explain why there are multiple possibilities for
8.
Consider the function
- Use a graph to explain visually why is not differentiable at
- Use the limit definition of the derivative to show that
- Investigate the value of by estimating the limit in (b) using small positive and negative values of For instance, you might compute Be sure to use several different values of (both positive and negative), including ones closer to 0 than 0.01. What do your results tell you about
- Use your graph in (a) to sketch an approximate graph of
1.8: The Tangent Line Approximation
1. Approximating
2. Local linearization of a graph
3. Estimating with the local linearization
4. Predicting behavior from the local linearization
5
A certain function has its local linearization at given by
- What are the values of and Why?
- Estimate the value of
- Suppose that and you know that for Is your estimate in (b) too large or too small?
- Suppose that for Use this fact and the additional information above to sketch an accurate graph of near Include a sketch of in your work.
6
A potato is placed in an oven, and the potato's temperature (in degrees Fahrenheit) at various points in time is taken and recorded in the following table. Time is measured in minutes.
- Use a central difference to estimate Use this estimate as needed in subsequent questions.
- Find the local linearization to the function at the point where
- Determine an estimate for by employing the local linearization.
- Do you think your estimate in (c) is too large or too small? Why?
7
An object moving along a straight line path has a differentiable position function measures the object's position relative to the origin at time It is known that at time seconds, the object's position is feet (i.e., 4 feet to the right of the origin). Furthermore, the object's instantaneous velocity at is feet per second, and its acceleration at the same instant is feet per second per second.
- Use local linearity to estimate the position of the object at
- Is your estimate likely too large or too small? Why?
- In everyday language, describe the behavior of the moving object at Is it moving toward the origin or away from it? Is its velocity increasing or decreasing?
8
For a certain function its derivative is known to be Note that you do not know a formula for
- At what -value(s) is Justify your answer algebraically, but include a graph of to support your conclusion.
- Reasoning graphically, for what intervals of -values is What does this tell you about the behavior of the original function Explain.
- Assuming that estimate the value of by finding and using the tangent line approximation to at Is your estimate larger or smaller than the true value of Justify your answer.