We all buy used products – cars, computers, textbooks, and so on – and we sometimes assume the sellers of those products will be forthright about any underlying problems with what they’re selling. This is not something we should take for granted. Researchers recruited 219 participants in a study where they would sell a used iPod1 that was known to have frozen twice in the past. The participants were incentivized to get as much money as they could for the iPod since they would receive a 5% cut of the sale on top of $10 for participating. The researchers wanted to understand what types of questions would elicit the seller to disclose the freezing issue.
Unbeknownst to the participants who were the sellers in the study, the buyers were collaborating with the researchers to evaluate the influence of different questions on the likelihood of getting the sellers to disclose the past issues with the iPod. The scripted buyers started with “Okay, I guess I’m supposed to go first. So you’ve had the iPod for 2 years ...” and ended with one of three questions:
General: What can you tell me about it?
Positive Assumption: It doesn’t have any problems, does it?
Negative Assumption: What problems does it have?
The question is the treatment given to the sellers, and the response is whether the question prompted them to disclose the freezing issue with the iPod. The results are shown in Figure 6.14, and the data suggest that asking the, What problems does it have?, was the most effective at getting the seller to disclose the past freezing issues. However, you should also be asking yourself: could we see these results due to chance alone, or is this in fact evidence that some questions are more effective for getting at the truth?
| General | Positive Assumption | Negative Assumption | Total | |
|---|---|---|---|---|
| Disclose Problem | 2 | 23 | 36 | 61 |
| Hide Problem | 71 | 50 | 37 | 158 |
| Total | 73 | 73 | 73 | 219 |
Differences of one-way tables vs two-way tables
A one-way table describes counts for each outcome in a single variable. A two-way table describes counts for combinations of outcomes for two variables. When we consider a two-way table, we often would like to know, are these variables related in any way? That is, are they dependent (versus independent)?
The hypothesis test for the iPod experiment is really about assessing whether there is statistically significant evidence that the success each question had on getting the participant to disclose the problem with the iPod. In other words, the goal is to check whether the buyer’s question was independent of whether the seller disclosed a problem.
Expected counts in two-way tables
with one-way tables, we will need to compute estimated counts for each cell in a two-way table.
Example 6.38
From the experiment, we can compute the proportion of all sellers who disclosed the freezing problem as . If there really is no difference among the questions and 27.85% of sellers were going to disclose the freezing problem no matter the question that was put to them, how many of the 73 people in the General group would we have expected to disclose the freezing problem?
We would predict that sellers would disclose the problem. Obviously we observed fewer than this, though it is not yet clear if that is due to chance variation or whether that is because the questions vary in how effective they are at getting to the truth.
Guided Practice 6.39
If the questions were actually equally effective, meaning about 27.85% of respondents would disclose the freezing issue regardless of what question they were asked, about how many sellers would we expect to hide the freezing problem from the Positive Assumption group?2
We can compute the expected number of sellers who we would expect to disclose or hide the freezing issue for all groups, if the questions had no impact on what they disclosed, using the same strategy employed in Example 6.38 and Guided Practice 6.39. These expected counts were used to construct Figure 6.15, which is the same as Figure 6.14, except now the expected counts have been added in parentheses.
| General | Positive Assumption | Negative Assumption | Total | |
|---|---|---|---|---|
| Disclose Problem | 2 (20.33) | 23 (20.33) | 36 (20.33) | 61 |
| Hide Problem | 71 (52.67) | 50 (52.67) | 37 (52.67) | 158 |
| Total | 73 | 73 | 73 | 219 |
The examples and exercises above provided some help in computing expected counts. In general, expected counts for a two-way table may be computed using the row totals, column totals, and the table total. For instance, if there was no difference between the groups, then about 27.85% of each column should be in the first row: Looking back to how 0.2785 was computed – as the fraction of sellers who disclosed the freezing issue () – these three expected counts could have been computed as This leads us to a general formula for computing expected counts in a two-way table when we would like to test whether there is strong evidence of an association between the column variable and row variable.
Computing expected counts in a two-way table
To identify the expected count for the row and column, compute
The chi-square test for two-way tables
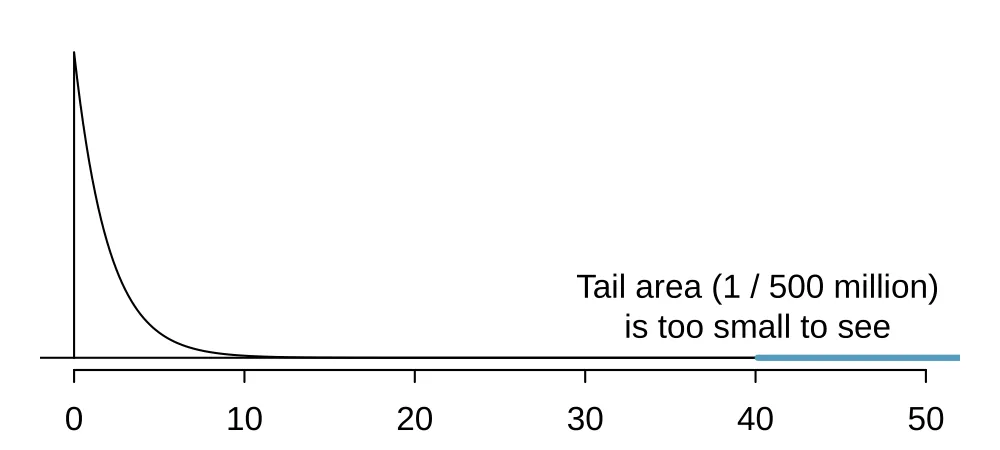
The chi-square test statistic for a two-way table is found the same way it is found for a one-way table. For each table count, compute Adding the computed value for each cell gives the chi-square test statistic : Just like before, this test statistic follows a chi-square distribution. However, the degrees of freedom are computed a little differently for a two-way table.3 For two way tables, the degrees of freedom is equal to In our example, the degrees of freedom parameter is If the null hypothesis is true (i.e. the questions had no impact on the sellers in the experiment), then the test statistic closely follows a chi-square distribution with 2 degrees of freedom. Using this information, we can compute the p-value for the test, which is depicted in Figure 6.16.
Computing degrees of freedom for a two-way table
When applying the chi-square test to a two-way table, we use where is the number of rows in the table and is the number of columns.
When analyzing 2-by-2 contingency tables, one guideline is to use the two-proportion methods introduced in Section 6.2.
Example 6.40
Find the p-value and draw a conclusion about whether the question affects the sellers likelihood of reporting the freezing problem.
Using a computer, we can compute a very precise value for the tail area above for a chi-square distribution with 2 degrees of freedom: 0.000000002. (If using the table in Appendix C.3, we would identify the p-value is smaller than 0.001.) Using a significance level of , the null hypothesis is rejected since the p-value is smaller. That is, the data provide convincing evidence that the question asked did affect a seller’s likelihood to tell the truth about problems with the iPod.
Example 6.41
Figure 6.17 summarizes the results of an experiment evaluating three treatments for Type 2 Diabetes in patients aged 10-17 who were being treated with metformin. The three treatments considered were continued treatment with metformin (met), treatment with metformin combined with rosiglitazone (rosi), or a lifestyle intervention program. Each patient had a primary outcome, which was either lacked glycemic control (failure) or did not lack that control (success). What are appropriate hypotheses for this test?
There is no difference in the effectiveness of the three treatments.
There is some difference in effectiveness between the three treatments, e.g. perhaps the
rositreatment performed better thanlifestyle.
| Failure | Success | Total | ||
|---|---|---|---|---|
lifestyle |
109 | 125 | 234 | |
met |
120 | 112 | 232 | |
rosi |
90 | 143 | 233 | |
| Total | 319 | 380 | 699 |
Guided Practice 6.42
A chi-square test for a two-way table may be used to test the hypotheses in Example 6.41. As a first step, compute the expected values for each of the six table cells.4
Guided Practice 6.44
Because there are 3 rows and 2 columns, the degrees of freedom for the test is . Use , , evaluate whether to reject the null hypothesis using a significance level of 0.05.6
Exercises
Exercise 6.35
Quitters. Does being part of a support group affect the ability of people to quit smoking? A county health department enrolled 300 smokers in a randomized experiment. 150 participants were assigned to a group that used a nicotine patch and met weekly with a support group; the other 150 received the patch and did not meet with a support group. At the end of the study, 40 of the participants in the patch plus support group had quit smoking while only 30 smokers had quit in the other group.
Create a two-way table presenting the results of this study.
Answer each of the following questions under the null hypothesis that being part of a support group does not affect the ability of people to quit smoking, and indicate whether the expected values are higher or lower than the observed values.
How many subjects in the “patch + support" group would you expect to quit?
How many subjects in the “patch only" group would you expect to not quit?
Exercise 6.36
Full body scan, Part II. The table below summarizes a data set we first encountered in Exercise 6.26 regarding views on full-body scans and political affiliation. The differences in each political group may be due to chance. Complete the following computations under the null hypothesis of independence between an individual’s party affiliation and his support of full-body scans. It may be useful to first add on an extra column for row totals before proceeding with the computations.
| Party Affiliation | ||||
| Republican | Democrat | Independent | ||
| Answer | Should | 264 | 299 | 351 |
| Should not | 38 | 55 | 77 | |
| Don’t know/No answer | 16 | 15 | 22 | |
| Total | 318 | 369 | 450 | |
How many Republicans would you expect to not support the use of full-body scans?
How many Democrats would you expect to support the use of full- body scans?
How many Independents would you expect to not know or not answer?
Exercise 6.37
Offshore drilling, Part III. The table below summarizes a data set we first encountered in Exercise 6.23 that examines the responses of a random sample of college graduates and non-graduates on the topic of oil drilling. Complete a chi-square test for these data to check whether there is a statistically significant difference in responses from college graduates and non-graduates.
| College Grad | ||
| Yes | No | |
| Support | 154 | 132 |
| Oppose | 180 | 126 |
| Do not know | 104 | 131 |
| Total | 438 | 389 |
Exercise 6.38
Parasitic worm. Lymphatic filariasis is a disease caused by a parasitic worm. Complications of the disease can lead to extreme swelling and other complications. Here we consider results from a randomized experiment that compared three different drug treatment options to clear people of the this parasite, which people are working to eliminate entirely. The results for the second year of the study are given below:7
| Clear at Year 2 | Not Clear at Year 2 | |
|---|---|---|
| Three drugs | 52 | 2 |
| Two drugs | 31 | 24 |
| Two drugs annually | 42 | 14 |
Statistical software was used to run a chi-square test, which output: Use these results to evaluate the hypotheses from part (6.38), and provide a conclusion in the context of the problem.
Notes
For readers not as old as the authors, an iPod is basically an iPhone without any cellular service, assuming it was one of the later generations. Earlier generations were more basic. ↩
We would expect . It is okay that this result, like the result from Example 6.38, is a fraction. ↩
Recall: in the one-way table, the degrees of freedom was the number of cells minus 1. ↩
The expected count for row one / column one is found by multiplying the row one total (234) and column one total (319), then dividing by the table total (699): . Similarly for the second column and the first row: . Row 2: 105.9 and 126.1. Row 3: 106.3 and 126.7. ↩
For each cell, compute . For instance, the first row and first column: . Adding the results of each cell gives the chi-square test statistic: . ↩
If using a computer, we can identify the p-value as 0.017. That is, we reject the null hypothesis because the p-value is less than 0.05, and we conclude that at least one of the treatments is more or less effective than the others at treating Type 2 Diabetes for glycemic control. ↩
King, Christopher et al. A Trial of a Triple-Drug Treatment for Lymphatic Filariasis. New England Journal of Medicine. 2018. ↩