Motivating Questions
- What is a function of several variables? What do we mean by the domain of a function of several variables?
- How do we find the distance between two points in What is the equation of a sphere in
- What is a trace of a function of two variables? What does a trace tell us about a function?
- What is a level curve of a function of two variables? What does a level curve tell us about a function?
Throughout our mathematical careers we have studied functions of a single variable. We define a function of one variable as a rule that assigns exactly one output to each input. We analyze these functions by looking at their graphs, calculating limits, differentiating, integrating, and more. Functions of several variables will be the main focus of Chapters 10 and 11, where we will analyze these functions by looking at their graphs, calculating limits, differentiating, integrating, and more. We will see that many of the ideas from single variable calculus translate well to functions of several variables, but we will have to make some adjustments as well. In this chapter we introduce functions of several variables and then discuss some of the tools (vectors and vector-valued functions) that will help us understand and analyze functions of several variables.
Preview Activity
Suppose you invest money in an account that pays 5% interest compounded continuously. If you invest dollars in the account, the amount of money in the account after years is given by
The variables and are independent of each other, so using functional notation we write
- Find the amount of money in the account after 7 years if you originally invest 1000 dollars.
- Evaluate Explain in words what this calculation represents.
- Now consider only the situation where the amount invested is fixed at 1000 dollars. Calculate the amount of money in the account after years as indicated in Table . Round payments to the nearest penny.
Table . Amount of money in an account with an initial investment of 1000 dollars.
Duration (in years) 2 3 4 5 6 Amount (dollars) - Now consider the situation where we want to know the amount of money in the account after 10 years given various initial investments. Calculate the amount of money in the account as indicated in Table . Round payments to the nearest penny.
Table . Amount of money in an account after 10 years.
Initial investment (dollars) 500 1000 5000 7500 10000 Amount (dollars) - Describe as best you can the combinations of initial investments and time that result in an account containing $10,000.
Functions of Several Variables
Up to this point we have been concerned with functions of a single variable. What defined such a function is that every input in the domain produced a unique output in the range. We saw similar behavior in Preview Activity , where each pair of inputs produces a unique output Additionally, the two variables and had no real relation to each other. That is, we could choose any value of without considering what value might have, and we could select any value of to use without regard to what value might have. For that reason we say that the variables and are independent of each other. Thus, we call a function of the two independent variables and This is the key idea in defining a function of two independent variables.
Definition
A function of two independent variables is a rule that assigns to each ordered pair in some set exactly one real number
There is, of course, no reason to restrict ourselves to functions of only two variables—we can use any number of variables we like. For example,
defines as a function of the three variables and In general, a function of independent variables is a rule that assigns to an ordered -tuple in some set exactly one real number.
As with functions of a single variable, it is important to understand the set of inputs for which the function is defined.
Definition
The domain of a function is the set of all inputs at which the function is defined.
Activity
Identify the domain of each of the following functions. Draw a picture of each domain in the -plane.
Representing Functions of Two Variables
One of the techniques we use to study functions of one variable is to create a table of values. We can do the same for functions of two variables, except that our tables will have to allow us to keep track of both input variables. We can do this with a 2-dimensional table, where we list the -values down the first column and the -values across the first row. As an example, suppose we launch a projectile, using a golf club, a cannon, or some other device, from ground level. Under ideal conditions (ignoring wind resistance, spin, or any other forces except the force of gravity) the horizontal distance the object will travel depends on the initial velocity the object is given, and the angle at which it is launched. If we let represent the horizontal distance the object travels, then is a function of the two variables and and we represent in functional notation by
where is the acceleration due to gravity. (Note that is constant, 32 feet per second squared. We will derive this equation in a later section.) To create a table of values for we list the -values down the first column and the -values across the first row. The value is then displayed in the location where the row intersects the column, as shown in Table (where we measure in feet per second and in radians).
| 25 | 7.6 | 14.0 | 18.2 | 19.5 | 17.8 | 13.2 | 6.5 |
|---|---|---|---|---|---|---|---|
| 50 | 30.4 | 56.0 | 72.8 | 78.1 | 71.0 | 26.2 | |
| 75 | 68.4 | 163.8 | 175.7 | 159.8 | 118.7 | 58.9 | |
| 100 | 121.7 | 224.2 | 291.3 | 312.4 | 284.2 | 211.1 | 104.7 |
| 125 | 190.1 | 350.3 | 455.1 | 444.0 | 329.8 | 163.6 | |
| 150 | 273.8 | 504.4 | 655.3 | 702.8 | 639.3 | 474.9 | 235.5 |
| 175 | 372.7 | 686.5 | 892.0 | 956.6 | 870.2 | 646.4 | |
| 200 | 486.8 | 896.7 | 1165.0 | 1249.5 | 1136.6 | 844.3 | 418.7 |
| 225 | 616.2 | 1134.9 | 1474.5 | 1581.4 | 1438.5 | 1068.6 | 530.0 |
| 250 | 760.6 | 1401.1 | 1952.3 | 1776.0 | 1319.3 | 654.3 |
Activity
Complete Table by filling in the missing values of the function Round entries to the nearest tenth.
If is a function of a single variable then we define the graph of to be the set of points of the form where is in the domain of We then plot these points using the coordinate axes in order to visualize the graph. We can do a similar thing with functions of several variables. Table identifies points of the form and we define the graph of to be the set of these points.
Definition : Graph
The graph of a function is the set of points of the form where the point is in the domain of
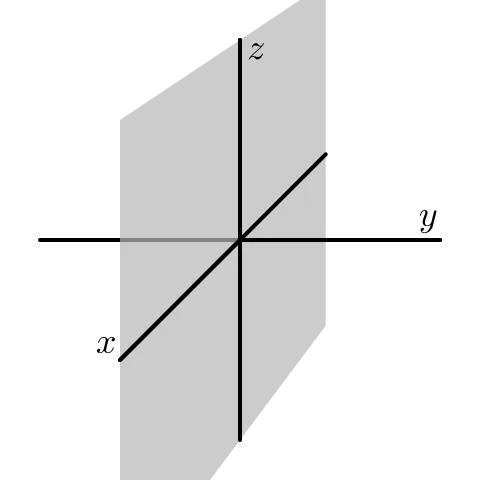
We also often refer to the graph of a function of two variables as the surface generated by Points in the form are in three dimensions, so plotting these points takes a bit more work than graphs of functions in two dimensions. To plot these three-dimensional points, we need to set up a coordinate system with three mutually perpendicular axes — the -axis, the -axis, and the -axis (called the coordinate axes). There are essentially two different ways we could set up a 3D coordinate system, as shown in Figure ; thus, before we can proceed, we need to establish a convention.
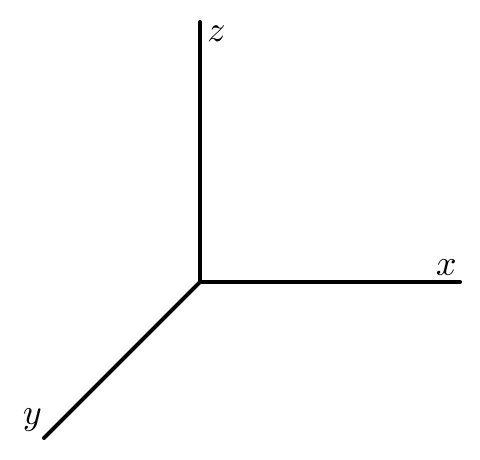
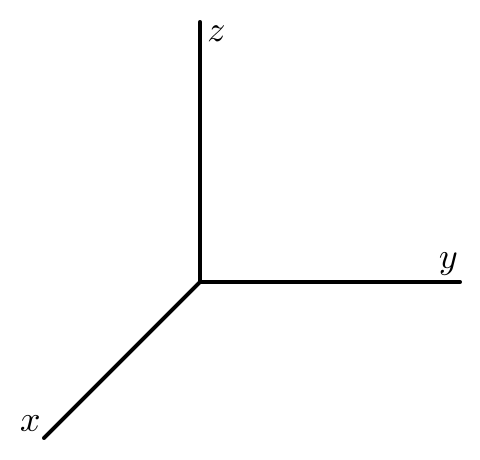
The distinction between these two figures is subtle, but important. In the coordinate system shown at left in Figure , imagine that you are sitting on the positive -axis next to the label “” Looking down at the - and -axes, you see that the -axis is obtained by rotating the -axis by 90 in the clockwise direction. Again sitting on the positive -axis in the coordinate system at right in Figure , you see that the -axis is obtained by rotating the -axis by 90 in the counterclockwise direction.
We call the coordinate system at right in Figure a right-hand system; if we point the index finger of our right hand along the positive -axis and our middle finger along the positive -axis, then our thumb points in the direction of the positive -axis. Following mathematical conventions, we choose to use a right-hand system throughout this book.
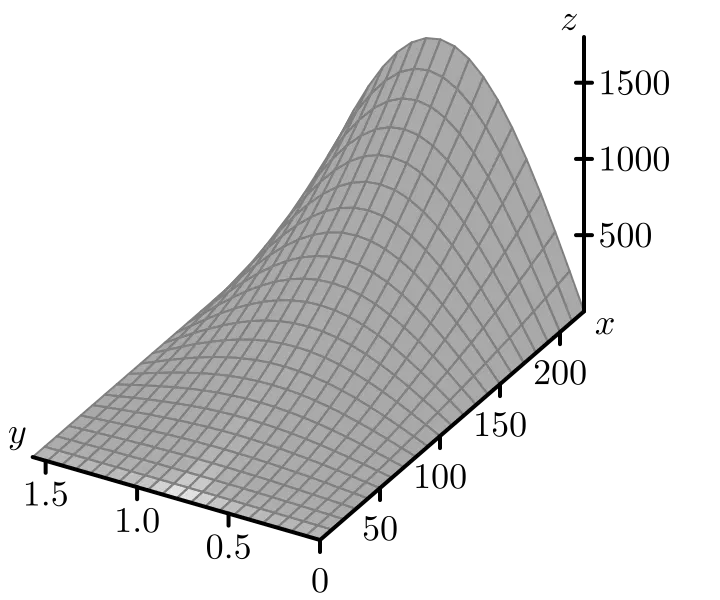
Now that we have established a convention for a right-hand system, we can draw a graph of the distance function defined by Note that the function is continuous in both variables, so when we plot these points in the right hand coordinate system, we can connect them all to form a surface in 3-space. The graph of the distance function is shown in Figure .
There are many graphing tools available for drawing three-dimensional surfaces as indicated in the Preface (see Links to interactive graphics in Features of the Text). Since we will be able to visualize graphs of functions of two independent variables, but not functions of more than two variables, we will primarily deal with functions of two variables in this text. It is important to note, however, that the techniques we develop apply to functions of any number of variables.
Notation: We let denote the set of all ordered pairs of real numbers in the plane (two copies of the real number system) and let represent the set of all ordered triples of real numbers (which constitutes three-space).
Some Standard Equations in Three-Space
In addition to graphing functions, we will also want to understand graphs of some simple equations in three dimensions. For example, in the graphs of the equations and where and are constants, are lines parallel to the coordinate axes. In the next activity we consider their three-dimensional analogs.
Activity
- Consider the set of points that satisfy the equation Describe this set as best you can.
- Consider the set of points that satisfy the equation Describe this set as best you can.
- Consider the set of points that satisfy the equation Describe this set as best you can.
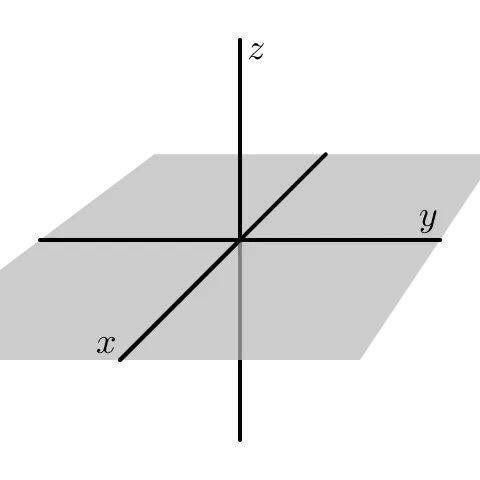
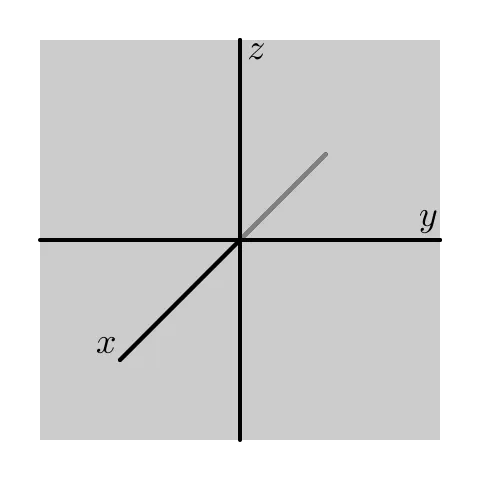
Activity shows that the equations where one independent variable is constant lead to planes parallel to ones that result from a pair of the coordinate axes. When we make the constant 0, we get the coordinate planes. The -plane satisfies the -plane satisfies and the -plane satisfies (see Figure ).
On a related note, we define a circle in as the set of all points equidistant from a fixed point. In we call the set of all points equidistant from a fixed point a sphere. To find the equation of a sphere, we need to understand how to calculate the distance between two points in three-space, and we explore this idea in the next activity.
Activity
Let and be two points in These two points form opposite vertices of a rectangular box whose sides are planes parallel to the coordinate planes as illustrated in Figure 0, and the distance between and is the length of the blue diagonal shown in Figure .
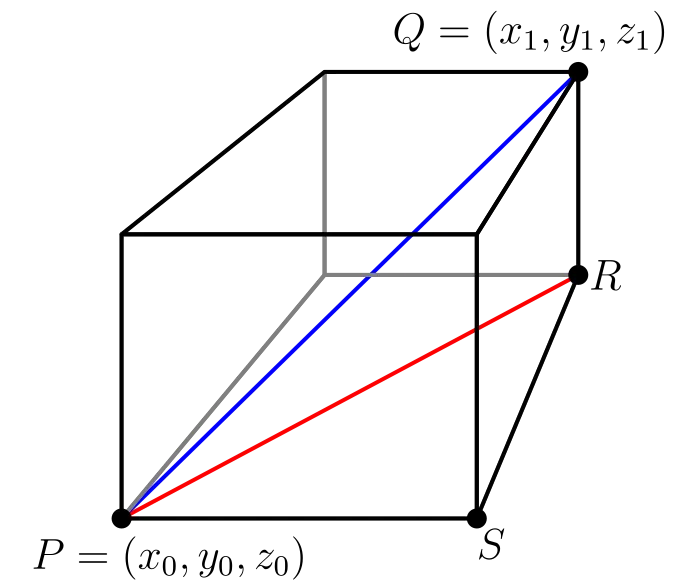
- Consider the right triangle in the base of the box whose hypotenuse is shown as the red line in Figure 0. What are the coordinates of the vertices of this triangle? Since this right triangle lies in a plane, we can use the Pythagorean Theorem to find a formula for the length of the hypotenuse of this triangle. Find such a formula, which will be in terms of and
- Now notice that the triangle whose hypotenuse is the blue segment connecting the points and with a leg as the hypotenuse of the triangle found in part (a) lies entirely in a plane, so we can again use the Pythagorean Theorem to find the length of its hypotenuse. Explain why the length of this hypotenuse, which is the distance between the points and is
The formula developed in Activity is important to remember.
The distance between points
The distance between points and (denoted as ) in is given by the formula
Equation () can be used to derive the formula for a sphere centered at a point with radius Since the distance from any point on such a sphere to the point is the point will satisfy the equation
Squaring both sides, we come to the standard equation for a sphere.
The equation of a sphere
The equation of a sphere with center and radius is
This makes sense if we compare this equation to its two-dimensional analogue, the equation of a circle of radius in the plane centered at
Traces
When we study functions of several variables we are often interested in how each individual variable affects the function in and of itself. In Preview Activity , we saw that the amount of money in an account depends on the amount initially invested and the duration of the investment. However, if we fix the initial investment, the amount of money in the account depends only on the duration of the investment, and if we set the duration of the investment constant, then the amount of money in the account depends only on the initial investment. This idea of keeping one variable constant while we allow the other to change will be an important tool for us when studying functions of several variables.
As another example, consider again the distance function defined by
where is the initial velocity of an object in feet per second, is the launch angle in radians, and is the acceleration due to gravity (32 feet per second squared). If we hold the launch angle constant at radians, we can consider a function of the initial velocity alone. In this case we have
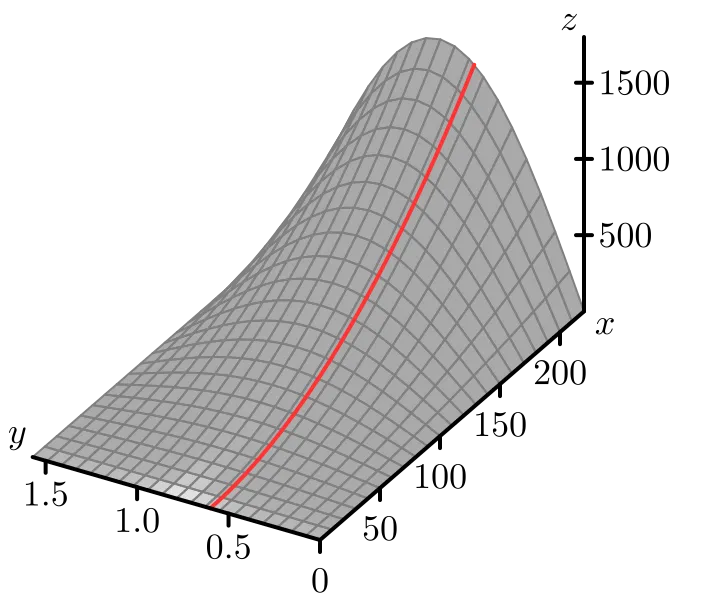
We can plot this curve on the surface by tracing out the points on the surface when as shown at left in Figure 1. The formula clearly shows that is quadratic in the -direction. More descriptively, as we increase the launch velocity while keeping the launch angle constant, the horizontal distance the object travels increases proportional to the square of the initial velocity.
Similarly, if we fix the initial velocity at 150 feet per second, we can consider the distance as a function of the launch angle only. In this case we have
We can again plot this curve on the surface by tracing out the points on the surface when as shown at right in Figure . The formula clearly show that is sinusoidal in the -direction. More descriptively, as we increase the launch angle while keeping the initial velocity constant, the horizontal distance traveled by the object is proportional to the sine of twice the launch angle.
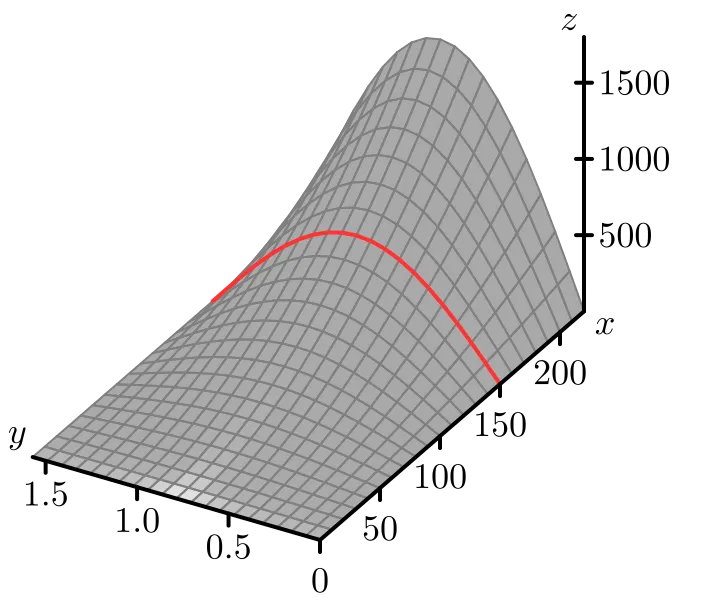
The curves we define when we fix one of the independent variables in our two variable function are called traces.
Definition
A trace of a function of two independent variables and in the direction is a curve of the form where is a constant. Similarly, a trace of a function of two independent variables and in the direction is a curve of the form where is a constant.
Understanding trends in the behavior of functions of two variables can be challenging, as can sketching their graphs; traces help us with each of these tasks.
Activity
In the following questions, we investigate the use of traces to better understand a function through both tables and graphs.
a. Identify the trace for the distance function defined by by highlighting or circling the appropriate cells in Table . Write a sentence to describe the behavior of the function along this trace.
b. Identify the trace for the distance function by highlighting or circling the appropriate cells in Table . Write a sentence to describe the behavior of the function along this trace.
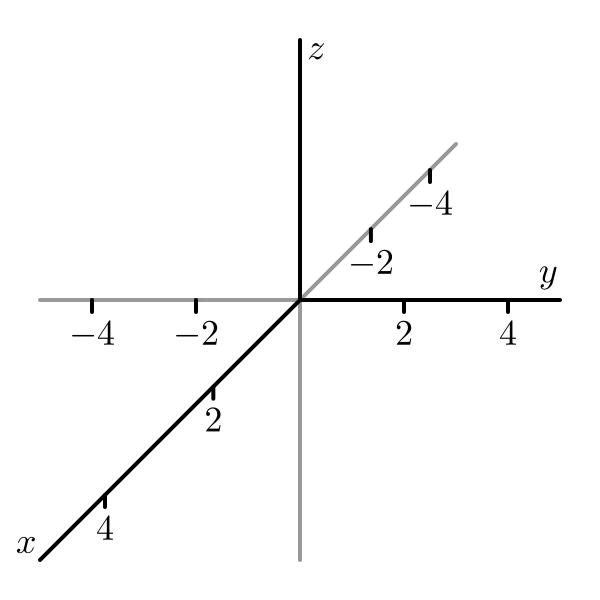
c. For the function defined by explain the type of function that each trace in the direction will be (keeping constant). Plot the and traces in 3-dimensional coordinate system provided in Figure 3.
d. For the function defined by explain the type of function that each trace in the direction will be (keeping constant). Plot the and traces in 3-dimensional coordinate system in Figure .
e. Describe the surface generated by the function
Contour Maps and Level Curves
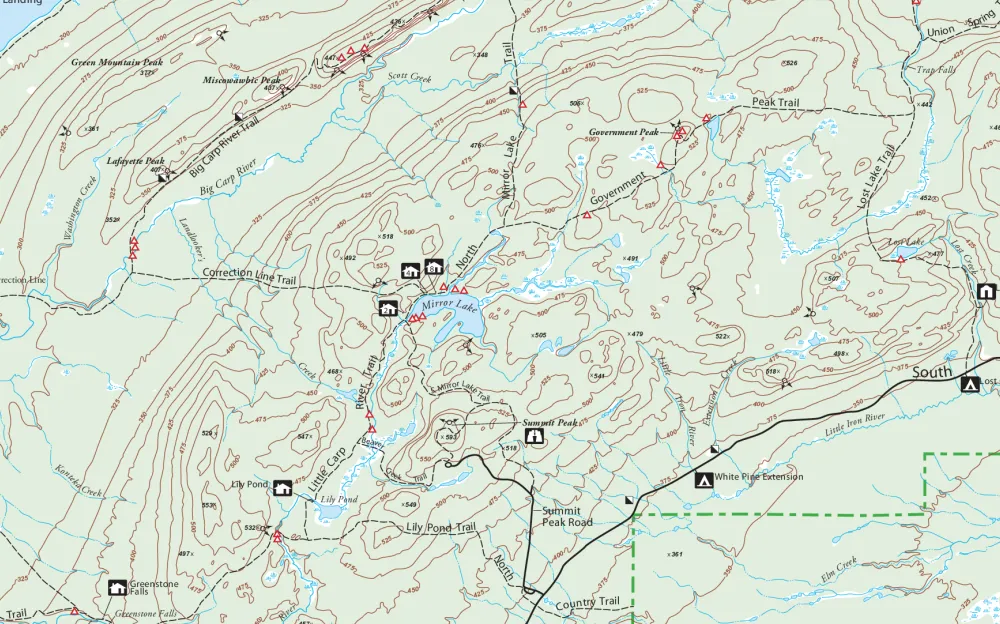
We have all seen topographic maps such as the one of the Porcupine Mountains in the upper peninsula of Michigan shown in Figure . 1 The curves on these maps show the regions of constant altitude. The contours also depict changes in altitude: contours that are close together signify steep ascents or descents, while contours that are far apart indicate only slight changes in elevation. Thus, contour maps tell us a lot about three-dimensional surfaces. Mathematically, if represents the altitude at the point then each contour is the graph of an equation of the form for some constant
Activity
On the topographical map of the Porcupine Mountains in Figure ,
- identify the highest and lowest points you can find;
- from a point of your choice, determine a path of steepest ascent that leads to the highest point;
- from that same initial point, determine the least steep path that leads to the highest point.
Curves on a surface that describe points at the same height or level are called level curves.
Definition
A level curve (or contour) of a function of two independent variables and is a curve of the form where is a constant.
Topographical maps can be used to create a three-dimensional surface from the two-dimensional contours or level curves. For example, level curves of the distance function defined by plotted in the -plane are shown at left in Figure . If we lift these contours and plot them at their respective heights, then we get a picture of the surface itself, as illustrated at right in Figure .
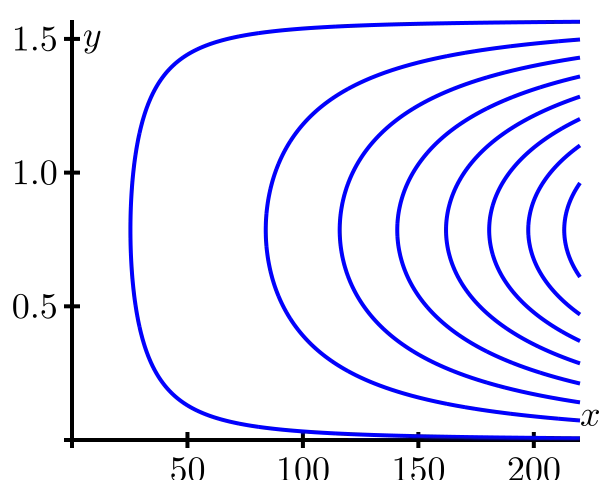
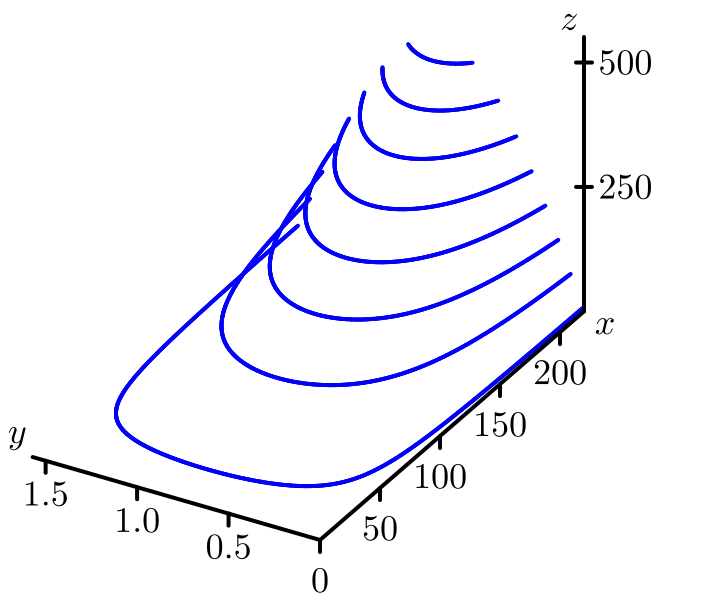
The use of level curves and traces can help us construct the graph of a function of two variables.
Activity
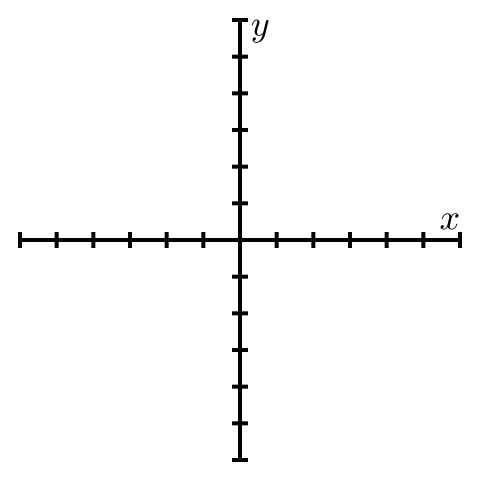
- Let Draw the level curves for and on the left set of axes given in Figure 7. (You decide on the scale of the axes.) Explain what the surface defined by looks like.
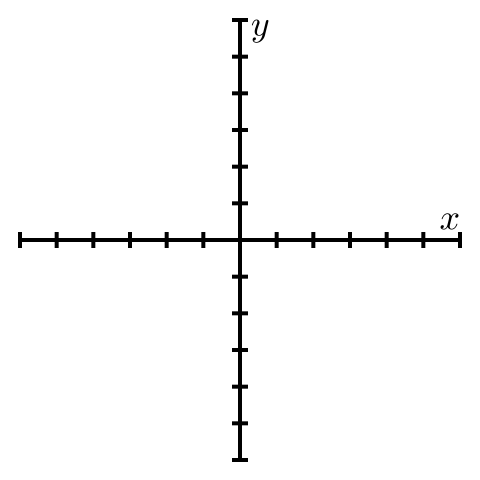
- Let Draw the level curves for and on the right set of axes given in Figure 7. (You decide on the scale of the axes.) Explain what the surface defined by looks like.
- Compare and contrast the graphs of and How are they alike? How are they different? Use traces for each function to help answer these questions.
The traces and level curves of a function of two variables are curves in space. In order to understand these traces and level curves better, we will first spend some time learning about vectors and vector-valued functions in the next few sections and return to our study of functions of several variables once we have those more mathematical tools to support their study.
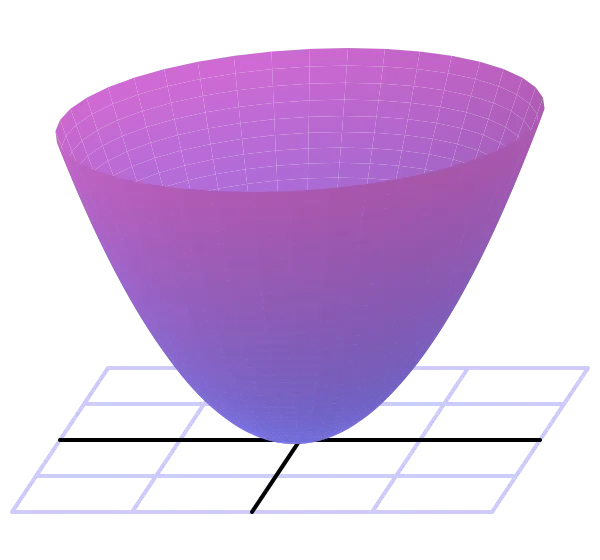
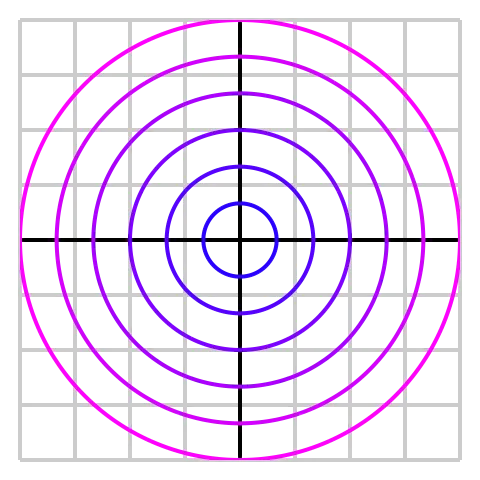
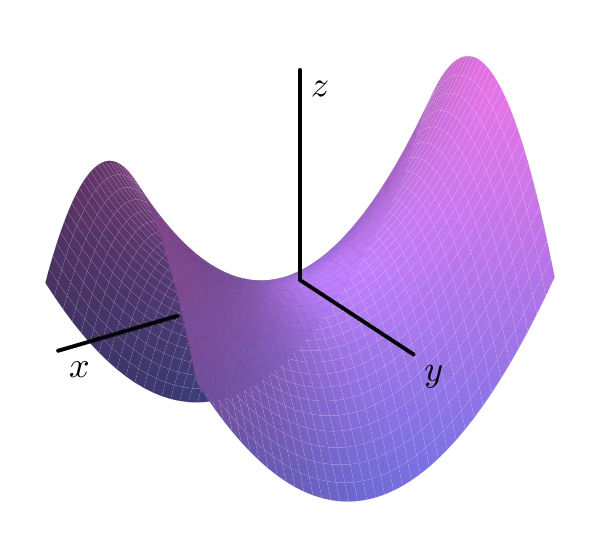
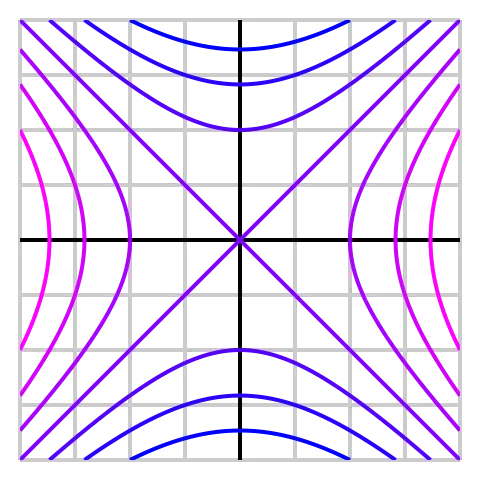
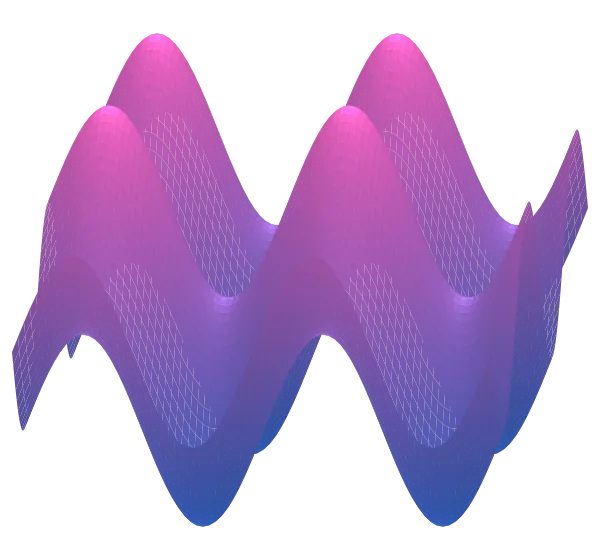
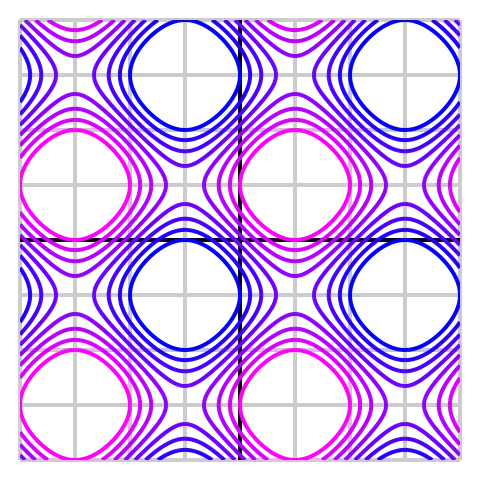
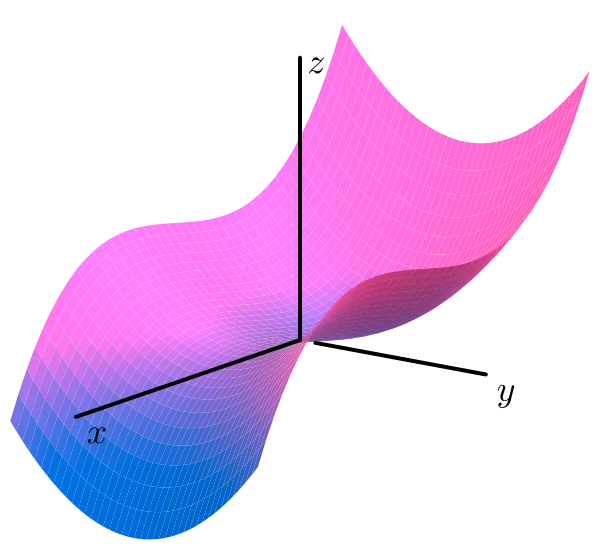
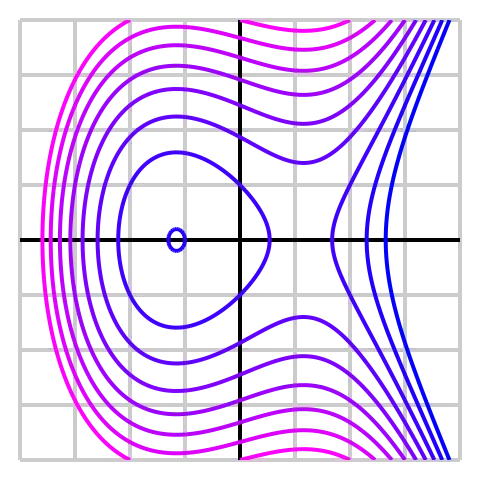
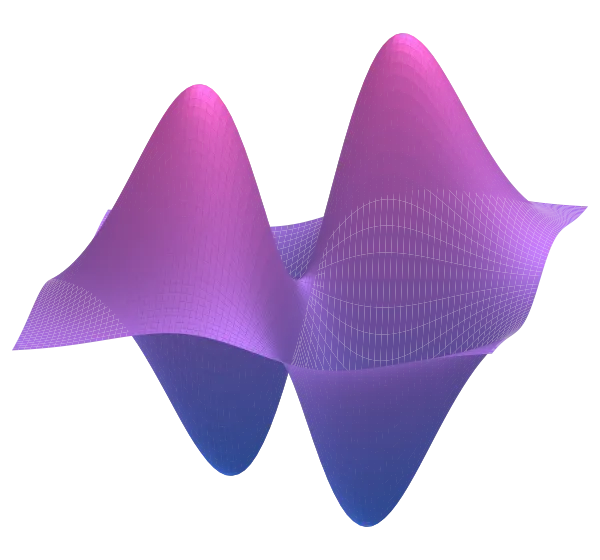
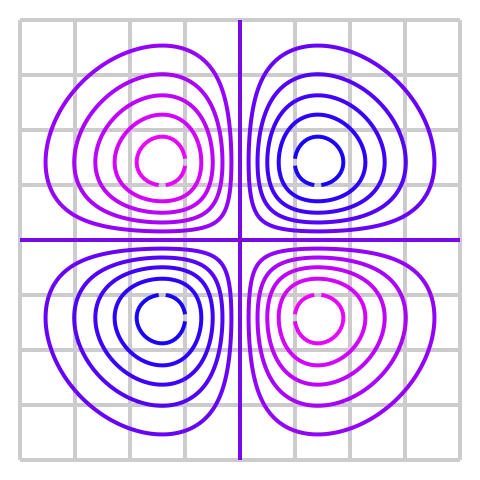
A gallery of functions
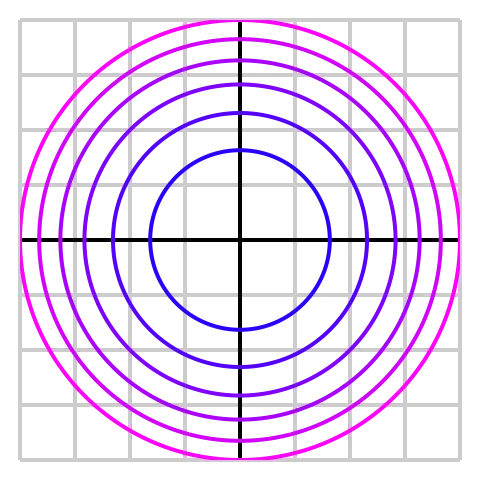
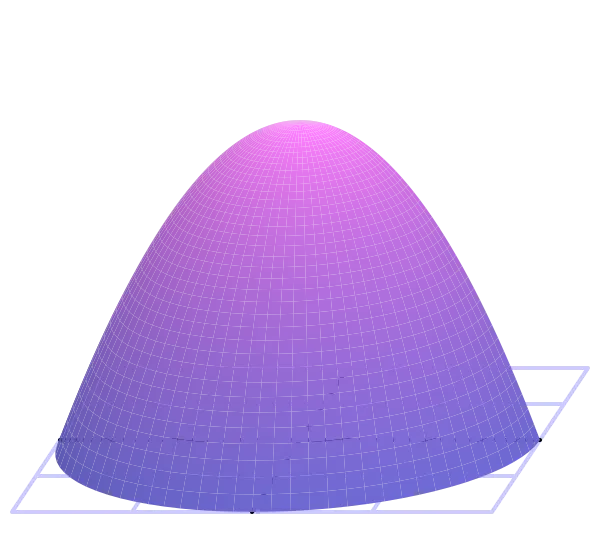
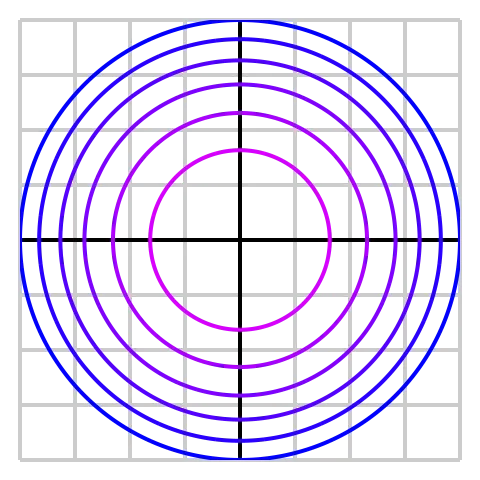
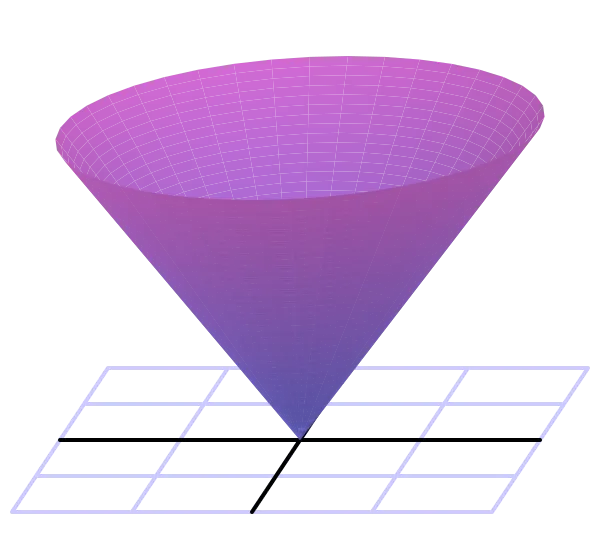
We end this section by considering a collection of functions and illustrating their graphs and some level curves.
Summary
- A function of several variables is a rule that assigns a unique number to an ordered collection of independent inputs. The domain of a function of several variables is the set of all inputs for which the function is defined.
- In the distance between points and (denoted as ) is given by the formula
and thus the equation of a sphere with center and radius is
- A trace of a function of two independent variables and is a curve of the form or where is a constant. A trace tells us how the function depends on a single independent variable if we treat the other independent variable as a constant.
- A level curve of a function of two independent variables and is a curve of the form where is a constant. A level curve describes the set of inputs that lead to a specific output of the function.