Motivating Questions
- How is the average rate of change of a function on a given interval defined, and what does this quantity measure?
- How is the instantaneous rate of change of a function at a particular point defined? How is the instantaneous rate of change linked to average rate of change?
- What is the derivative of a function at a given point? What does this derivative value measure? How do we interpret the derivative value graphically?
- How are limits used formally in the computation of derivatives?
The instantaneous rate of change of a function is an idea that sits at the foundation of calculus. It is a generalization of the notion of instantaneous velocity and measures how fast a particular function is changing at a given point. If the original function represents the position of a moving object, this instantaneous rate of change is precisely the velocity of the object. In other contexts, instantaneous rate of change could measure the number of cells added to a bacteria culture per day, the number of additional gallons of gasoline consumed by increasing a car's velocity one mile per hour, or the number of dollars added to a mortgage payment for each percentage point increase in interest rate. The instantaneous rate of change can also be interpreted geometrically on the function's graph, and this connection is fundamental to many of the main ideas in calculus.
Recall that for a moving object with position function its average velocity on the time interval to is given by the quotient
In a similar way, we make the following definition for an arbitrary function
Definition : Average Rate of Change
For a function the average rate of change of on the interval is given by the value
Equivalently, if we want to consider the average rate of change of on we compute
It is essential that you understand how the average rate of change of on an interval is connected to its graph.
Preview Activity
Suppose that is the function given by the graph below and that and are the input values as labeled on the -axis. Use the graph in Figure to answer the following questions.
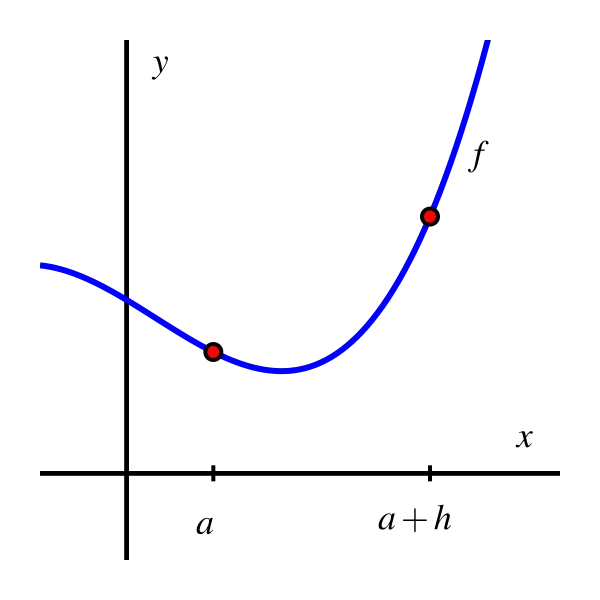
- Locate and label the points and on the graph.
- Construct a right triangle whose hypotenuse is the line segment from to What are the lengths of the respective legs of this triangle?
- What is the slope of the line that connects the points and
- Write a meaningful sentence that explains how the average rate of change of the function on a given interval and the slope of a related line are connected.
Just as we defined instantaneous velocity in terms of average velocity, we now define the instantaneous rate of change of a function at a point in terms of the average rate of change of the function over related intervals. This instantaneous rate of change of at is called “the derivative of at ” and is denoted by
Definition : Derivative
Let be a function and a value in the function's domain. We define the derivative of with respect to evaluated at , denoted by the formula
provided this limit exists.
Aloud, we read the symbol as either “-prime at ” or “the derivative of evaluated at ” Much of the next several chapters will be devoted to understanding, computing, applying, and interpreting derivatives. For now, we observe the following important things.
Note
- The derivative of at the value is defined as the limit of the average rate of change of on the interval as This limit may not exist, so not every function has a derivative at every point.
- We say that a function is differentiable at if it has a derivative at
- The derivative is a generalization of the instantaneous velocity of a position function: if is a position function of a moving body, tells us the instantaneous velocity of the body at time
- Because the units on are “units of per unit of ” the derivative has these very same units. For instance, if measures position in feet and measures time in seconds, the units on are feet per second.
- Because the quantity represents the slope of the line through and when we compute the derivative we are taking the limit of a collection of slopes of lines. Thus, the derivative itself represents the slope of a particularly important line.
We first consider the derivative at a given value as the slope of a certain line.
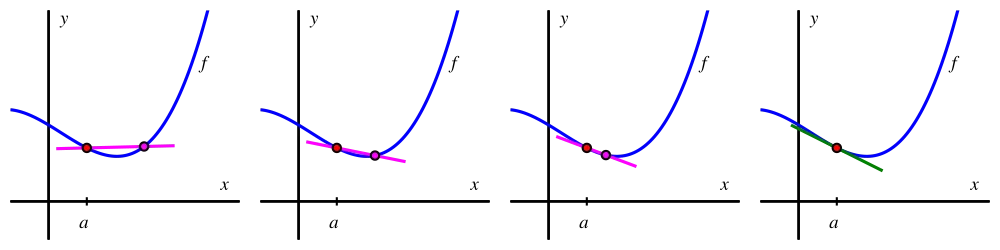
When we compute an instantaneous rate of change, we allow the interval to shrink as We can think of one endpoint of the interval as “sliding towards” the other. In particular, provided that has a derivative at the point will approach as Because the process of taking a limit is a dynamic one, it can be helpful to use computing technology to visualize it. One option is a java applet in which the user is able to control the point that is moving. For a helpful collection of examples, consider the work of David Austin of Grand Valley State University, and this particularly relevant example. For applets that have been built in Geogebra 1 , see Marc Renault's library via Shippensburg University, with this example being especially fitting for our work in this section.
Figure shows a sequence of figures with several different lines through the points and generated by different values of These lines (shown in the first three figures in magenta), are often called secant lines to the curve A secant line to a curve is simply a line that passes through two points on the curve. For each such line, the slope of the secant line is where the value of depends on the location of the point we choose. We can see in the diagram how, as the secant lines start to approach a single line that passes through the point If the limit of the slopes of the secant lines exists, we say that the resulting value is the slope of the tangent line to the curve. This tangent line (shown in the right-most figure in green) to the graph of at the point has slope
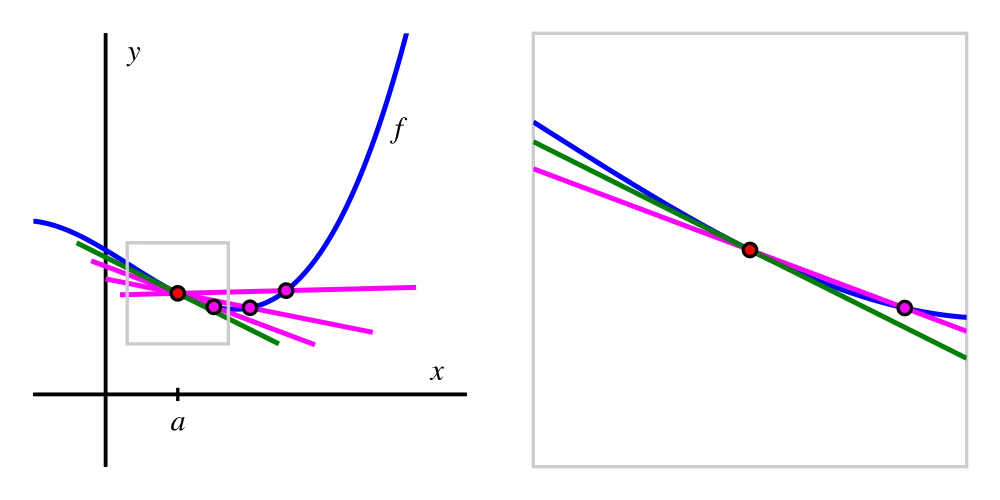
If the tangent line at exists, the graph of looks like a straight line when viewed up close at In Figure we combine the four graphs in Figure into the single one on the left, and zoom in on the box centered at on the right. Note how the tangent line sits relative to the curve at and how closely it resembles the curve near
Note
The instantaneous rate of change of with respect to at also measures the slope of the tangent line to the curve at
The following example demonstrates several key ideas involving the derivative of a function.
Example
For the function use the limit definition of the derivative to compute In addition, discuss the meaning of this value and draw a labeled graph that supports your explanation.
- Answer
-
From the limit definition, we know that
Now we use the rule for and observe that and Substituting these values into the limit definition, we have that
In order to let we must simplify the quotient. Expanding and distributing in the numerator,
Combining like terms, we have
Next, we remove a common factor of in both the numerator and denominator and find that
Finally, we are able to take the limit as and thus conclude that We note that is the instantaneous rate of change of at the point It is also the slope of the tangent line to the graph of at the point Figure shows both the function and the line through with slope
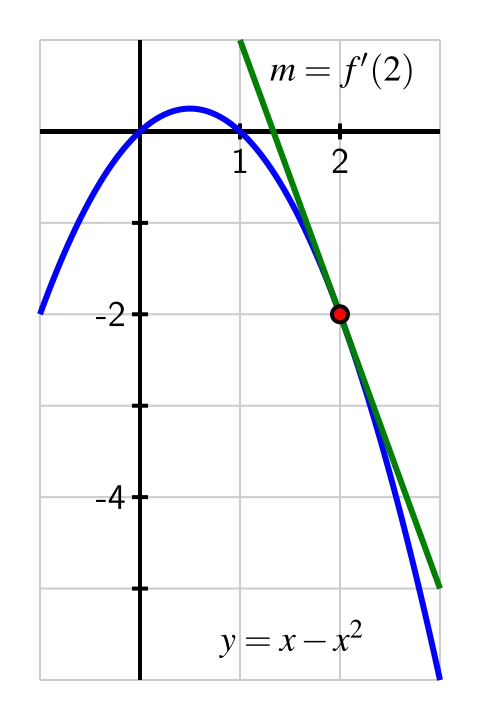
Figure . The tangent line to at the point .
The following activities will help you explore a variety of key ideas related to derivatives.
Activity
Consider the function whose formula is
- What familiar type of function is What can you say about the slope of at every value of
- Compute the average rate of change of on the intervals and simplify each result as much as possible. What do you notice about these quantities?
- Use the limit definition of the derivative to compute the exact instantaneous rate of change of with respect to at the value That is, compute using the limit definition. Show your work. Is your result surprising?
- Without doing any additional computations, what are the values of and Why?
Activity
A water balloon is tossed vertically in the air from a window. The balloon's height in feet at time in seconds after being launched is given by Use this function to respond to each of the following questions.
a. Sketch an accurate, labeled graph of on the axes provided in Figure . You should be able to do this without using computing technology.
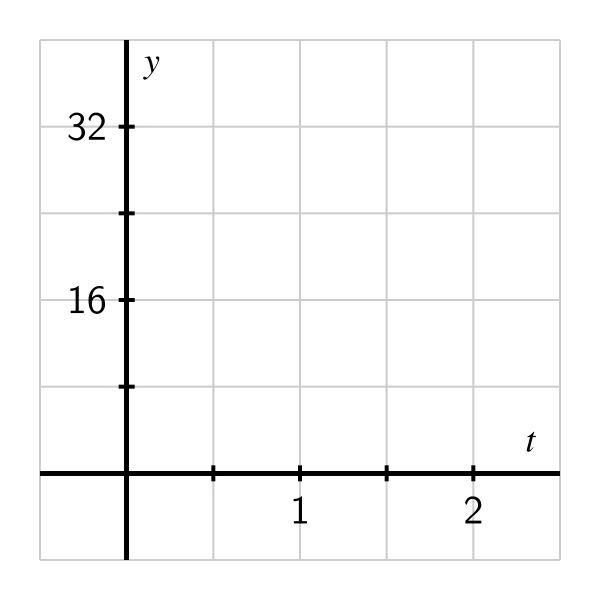
b. Compute the average rate of change of on the time interval Include units on your answer and write one sentence to explain the meaning of the value you found.
c. Use the limit definition to compute the instantaneous rate of change of with respect to time, at the instant Show your work using proper notation, include units on your answer, and write one sentence to explain the meaning of the value you found.
d. On your graph in (a), sketch two lines: one whose slope represents the average rate of change of on the other whose slope represents the instantaneous rate of change of at the instant Label each line clearly.
e. For what values of do you expect to be positive? Why? Answer the same questions when “positive” is replaced by “negative” and “zero.”
Activity
A rapidly growing city in Arizona has its population at time where is the number of decades after the year 2010, modeled by the formula Use this function to respond to the following questions.
a. Sketch an accurate graph of for to on the axes provided in Figure . Label the scale on the axes carefully.
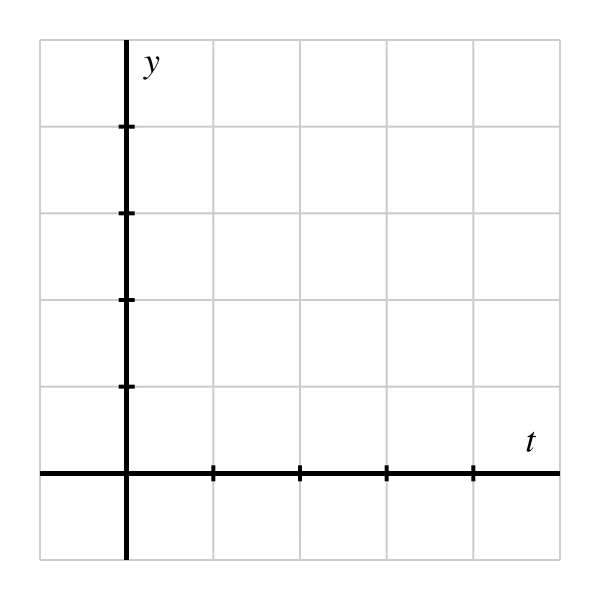
b. Compute the average rate of change of between 2030 and 2050. Include units on your answer and write one sentence to explain the meaning (in everyday language) of the value you found.
c. Use the limit definition to write an expression for the instantaneous rate of change of with respect to time, at the instant Explain why this limit is difficult to evaluate exactly.
d. Estimate the limit in (c) for the instantaneous rate of change of at the instant by using several small values. Once you have determined an accurate estimate of include units on your answer, and write one sentence (using everyday language) to explain the meaning of the value you found.
e. On your graph above, sketch two lines: one whose slope represents the average rate of change of on the other whose slope represents the instantaneous rate of change of at the instant
f. In a carefully-worded sentence, describe the behavior of as increases in value. What does this reflect about the behavior of the given function
Summary
- The average rate of change of a function on the interval is The units on the average rate of change are units of per unit of and the numerical value of the average rate of change represents the slope of the secant line between the points and on the graph of If we view the interval as being instead of the meaning is still the same, but the average rate of change is now computed by
- The instantaneous rate of change with respect to of a function at a value is denoted (read “the derivative of evaluated at ” or “-prime at ”) and is defined by the formula
provided the limit exists. Note particularly that the instantaneous rate of change at is the limit of the average rate of change on as
- Provided the derivative exists, its value tells us the instantaneous rate of change of with respect to at which geometrically is the slope of the tangent line to the curve at the point We even say that is the “slope of the curve” at the point
- Limits allow us to move from the rate of change over an interval to the rate of change at a single point.