Motivating Questions
- What is the mathematical notion of limit and what role do limits play in the study of functions?
- What is the meaning of the notation
- How do we go about determining the value of the limit of a function at a point?
- How do we manipulate average velocity to compute instantaneous velocity?
In Section 1.1 we used a function, to model the location of a moving object at a given time. Functions can model other interesting phenomena, such as the rate at which an automobile consumes gasoline at a given velocity, or the reaction of a patient to a given dosage of a drug. We can use calculus to study how a function value changes in response to changes in the input variable.
Think about the falling ball whose position function is given by Its average velocity on the interval is given by
Note that the average velocity is a function of That is, the function tells us the average velocity of the ball on the interval from to To find the instantaneous velocity of the ball when we need to know what happens to as gets closer and closer to But also notice that is not defined, because it leads to the quotient
This is where the notion of a limit comes in. By using a limit, we can investigate the behavior of as gets arbitrarily close, but not equal, to We first use the graph of a function to explore points where interesting behavior occurs.
Preview Activity .
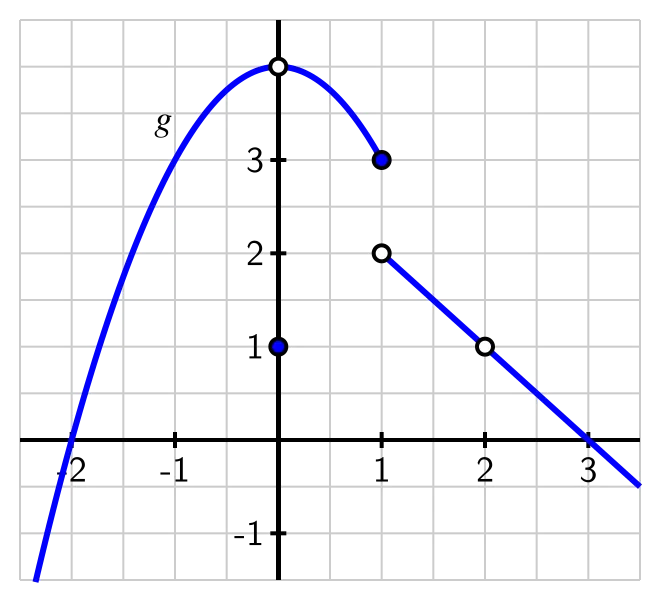
Suppose that is the function given by the graph below. Use the graph in Figure to answer each of the following questions.
- Determine the values and if defined. If the function value is not defined, explain what feature of the graph tells you this.
- For each of the values and complete the following sentence: “As gets closer and closer (but not equal) to gets as close as we want to ______________.”
- What happens as gets closer and closer (but not equal) to Does the function get as close as we would like to a single value?
Notion of Limit
Limits give us a way to identify a trend in the values of a function as its input variable approaches a particular value of interest. We need a precise understanding of what it means to say “a function has limit as approaches ” To begin, think about a recent example.
In Preview Activity , we saw that as gets closer and closer (but not equal) to 0, gets as close as we want to the value 4. At first, this may feel counterintuitive, because the value of is not But limits describe the behavior of a function arbitrarily close to a fixed input, and the value of the function at the fixed input does not matter. More formally, 1 we say the following.
What follows here is not what mathematicians consider the formal definition of a limit. To be completely precise, it is necessary to quantify both what it means to say “as close to as we like” and “sufficiently close to ” That can be accomplished through what is traditionally called the epsilon-delta definition of limits. The definition presented here is sufficient for the purposes of this text.
Definition
Given a function a fixed input and a real number we say that has limit as approaches , and write
provided that we can make as close to as we like by taking sufficiently close (but not equal) to If we cannot make as close to a single value as we would like as approaches then we say that does not have a limit as approaches
Example
For the function pictured in Figure, we make the following observations:
When working from a graph, it suffices to ask if the function approaches a single value from each side of the fixed input. The function value at the fixed input is irrelevant. This reasoning explains the values of the three limits stated above.
However, does not have a limit as There is a jump in the graph at If we approach from the left, the function values tend to get close to 3, but if we approach from the right, the function values get close to 2. There is no single number that all of these function values approach. This is why the limit of does not exist at
For any function there are typically three ways to answer the question “does have a limit at and if so, what is the limit?” The first is to reason graphically as we have just done with the example from Preview Activity . If we have a formula for there are two additional possibilities:
- Evaluate the function at a sequence of inputs that approach on either side (typically using some sort of computing technology), and ask if the sequence of outputs seems to approach a single value.
- Use the algebraic form of the function to understand the trend in its output values as the input values approach
The first approach produces only an approximation of the value of the limit, while the latter can often be used to determine the limit exactly.
Example : Limits of Two Functions
For each of the following functions, we'd like to know whether or not the function has a limit at the stated -values. Use both numerical and algebraic approaches to investigate and, if possible, estimate or determine the value of the limit. Compare the results with a careful graph of the function on an interval containing the points of interest.
- Answer
-
a. We first construct a graph of along with tables of values near and
Table . Table of values near Table . Table of values near 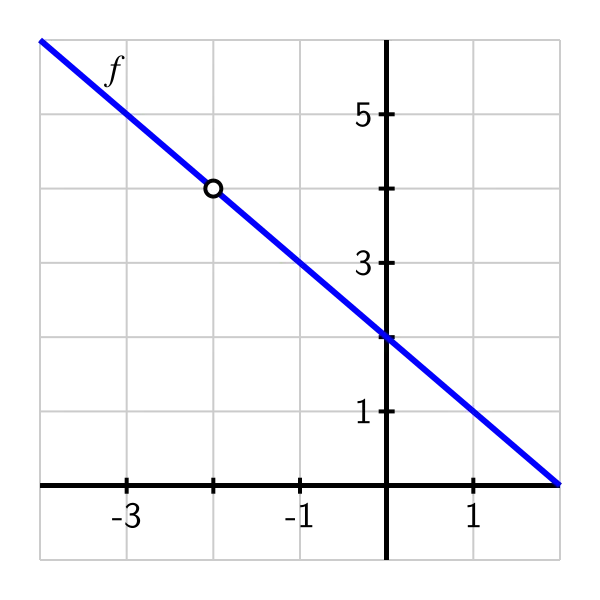 Figure . Plot of on
From Table , it appears that we can make as close as we want to 3 by taking sufficiently close to which suggests that This is also consistent with the graph of To see this a bit more rigorously and from an algebraic point of view, consider the formula for As and so as the numerator of tends to 3 and the denominator tends to 1, hence
The situation is more complicated when because is not defined. If we try to use a similar algebraic argument regarding the numerator and denominator, we observe that as and so as the numerator and denominator of both tend to 0. We call an indeterminate form. This tells us that there is somehow more work to do. From Table and Figure , it appears that should have a limit of at
To see algebraically why this is the case, observe that
It is important to observe that, since we are taking the limit as we are considering values that are close, but not equal, to Because we never actually allow to equal the quotient has value 1 for every possible value of Thus, we can simplify the most recent expression above, and find that
This limit is now easy to determine, and its value clearly is Thus, from several points of view we've seen that
b. Next we turn to the function and construct two tables and a graph.
Table . Table of values near Table . Table of values near 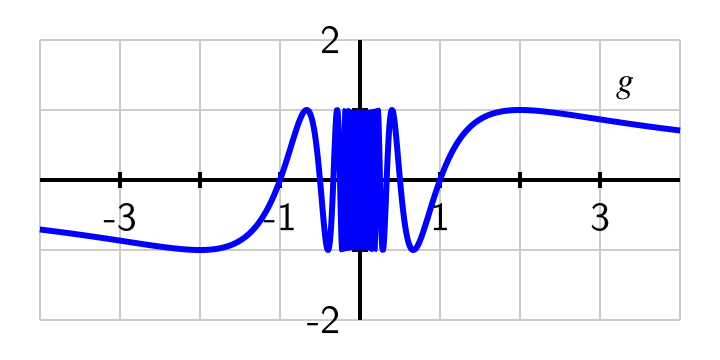
Figure . Plot of on First, as it appears from the table values that the function is approaching a number between and From the graph it appears that as The exact value of is which is approximately 0.8660254038. This is convincing evidence that
As we observe that does not behave in an elementary way. When is positive and approaching zero, we are dividing by smaller and smaller positive values, and increases without bound. When is negative and approaching zero, decreases without bound. In this sense, as we get close to the inputs to the sine function are growing rapidly, and this leads to increasingly rapid oscillations in the graph of betweem and If we plot the function with a graphing utility and then zoom in on we see that the function never settles down to a single value near the origin, which suggests that does not have a limit at
How do we reconcile the graph with the righthand table above, which seems to suggest that the limit of as approaches may in fact be The data misleads us because of the special nature of the sequence of input values When we evaluate we get for each positive integer value of But if we take a different sequence of values approaching zero, say then we find that
That sequence of function values suggests that the value of the limit is Clearly the function cannot have two different values for the limit, so has no limit as
An important lesson to take from Example is that tables can be misleading when determining the value of a limit. While a table of values is useful for investigating the possible value of a limit, we should also use other tools to confirm the value.
Activity
Estimate the value of each of the following limits by constructing appropriate tables of values. Then determine the exact value of the limit by using algebra to simplify the function. Finally, plot each function on an appropriate interval to check your result visually.
Recall that our primary motivation for considering limits of functions comes from our interest in studying the rate of change of a function. To that end, we close this section by revisiting our previous work with average and instantaneous velocity and highlighting the role that limits play.
Instantaneous Velocity
Suppose that we have a moving object whose position at time is given by a function We know that the average velocity of the object on the time interval is We define the instantaneous velocity at to be the limit of average velocity as approaches Note particularly that as the length of the time interval gets shorter and shorter (while always including ). We will write for the instantaneous velocity at and thus
Equivalently, if we think of the changing value as being of the form where is some small number, then we may instead write
Again, the most important idea here is that to compute instantaneous velocity, we take a limit of average velocities as the time interval shrinks.
Activity
Consider a moving object whose position function is given by where is measured in meters and is measured in minutes.
- Determine the most simplified expression for the average velocity of the object on the interval where
- Determine the average velocity of the object on the interval Include units on your answer.
- Determine the instantaneous velocity of the object when Include units on your answer.
The closing activity of this section asks you to make some connections among average velocity, instantaneous velocity, and slopes of certain lines.
Activity
For the moving object whose position at time is given by the graph in Figure, answer each of the following questions. Assume that is measured in feet and is measured in seconds.
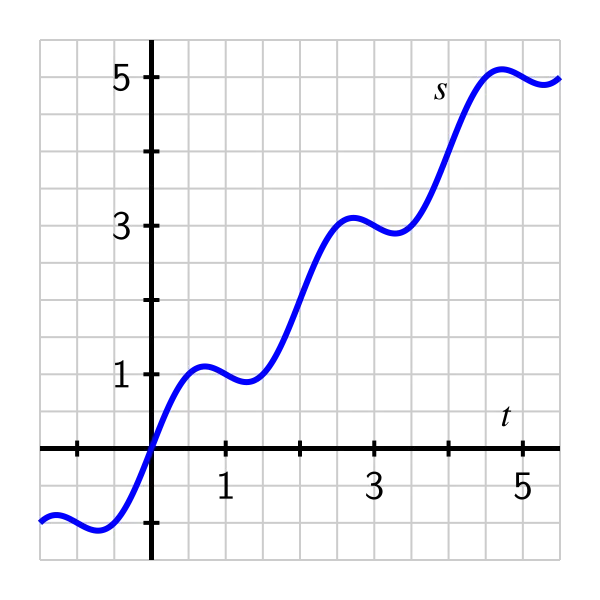
a. Use the graph to estimate the average velocity of the object on each of the following intervals: Draw each line whose slope represents the average velocity you seek.
b. How could you use average velocities or slopes of lines to estimate the instantaneous velocity of the object at a fixed time?
c. Use the graph to estimate the instantaneous velocity of the object when Should this instantaneous velocity at be greater or less than the average velocity on that you computed in (a)? Why?
Summary
- Limits enable us to examine trends in function behavior near a specific point. In particular, taking a limit at a given point asks if the function values nearby tend to approach a particular fixed value.
- We read as “the limit of as approaches is ” which means that we can make the value of as close to as we want by taking sufficiently close (but not equal) to
- To find for a given value of and a known function we can estimate this value from the graph of or we can make a table of function values for -values that are closer and closer to If we want the exact value of the limit, we can work with the function algebraically to understand how different parts of the formula for change as
- We find the instantaneous velocity of a moving object at a fixed time by taking the limit of average velocities of the object over shorter and shorter time intervals containing the time of interest.