Motivating Questions
- What are the critical numbers of a function and how are they connected to identifying the most extreme values the function achieves?
- How does the first derivative of a function reveal important information about the behavior of the function, including the function's extreme values?
- How can the second derivative of a function be used to help identify extreme values of the function?
In many different settings, we are interested in knowing where a function achieves its least and greatest values. These can be important in applications — say to identify a point at which maximum profit or minimum cost occurs — or in theory to characterize the behavior of a function or a family of related functions.
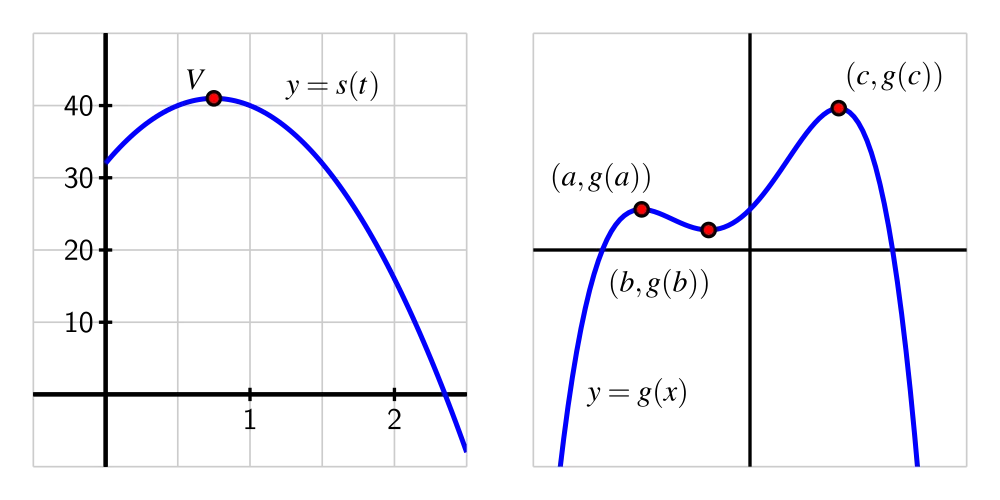
Consider the simple and familiar example of a parabolic function such as (shown at left in Figure ) that represents the height of an object tossed vertically: its maximum value occurs at the vertex of the parabola and represents the greatest height the object reaches. This maximum value is an especially important point on the graph, the point at which the curve changes from increasing to decreasing.
Definition
Given a function we say that is a global or absolute maximum of provided that for all in the domain of and similarly we call a global or absolute minimum of whenever for all in the domain of
For instance, in Figure , has a global maximum of but does not appear to have a global minimum, as the graph of seems to decrease without bound. Note that the point marks a fundamental change in the behavior of where changes from increasing to decreasing; similar things happen at both and although these points are not global minima or maxima.
Definition
We say that is a local maximum or relative maximum of provided that for all near and is called a local or relative minimum of whenever for all near
For example, in Figure , has a relative minimum of at the point and a relative maximum of at We have already identified the global maximum of as it can also be considered a relative maximum. Any maximum or minimum may also be called an extreme value of
We would like to use calculus ideas to identify and classify key function behavior, including the location of relative extremes. Of course, if we are given a graph of a function, it is often straightforward to locate these important behaviors visually.
Preview Activity
Consider the function given by the graph in Figure . Use the graph to answer each of the following questions.
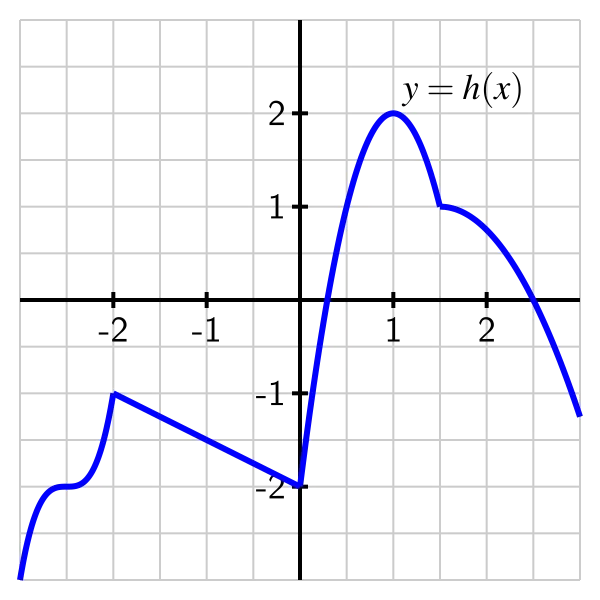
- Identify all of the values of such that for which is a local maximum of
- Identify all of the values of such that for which is a local minimum of
- Does have a global maximum on the interval If so, what is the value of this global maximum?
- Does have a global minimum on the interval If so, what is its value?
- Identify all values of for which
- Identify all values of for which does not exist.
- True or false: every relative maximum and minimum of occurs at a point where is either zero or does not exist.
- True or false: at every point where is zero or does not exist, has a relative maximum or minimum.
Critical numbers and the first derivative test
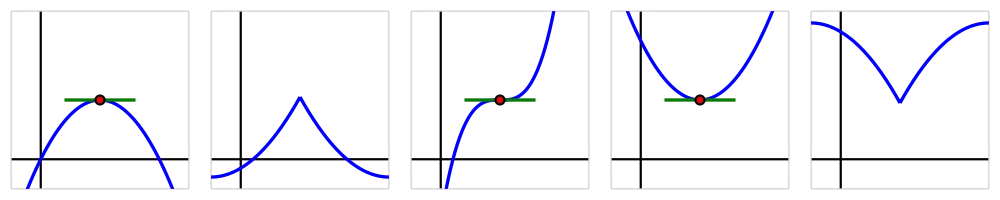
If a continuous function has a relative maximum at then it is both necessary and sufficient that the function change from being increasing just before to decreasing just after A continuous function has a relative minimum at if and only if the function changes from decreasing to increasing at (See Figure .) There are only two possible ways for these changes in behavior to occur: either or is undefined. Because these values of are so important, we call them critical numbers.
Definition
We say that a function has a critical number at provided that is in the domain of and or is undefined.
Critical numbers are the only possible locations where the function may have relative extremes. Note that not every critical number produces a maximum or minimum; in the middle graph of Figure , the function pictured there has a horizontal tangent line at the noted point, but the function is increasing before and increasing after, so the critical number does not yield a maximum or minimum.
When is a critical number, we say that is a critical point of the function, or that is a critical value . The first derivative test summarizes how sign changes in the first derivative (which can only occur at critical numbers) indicate the presence of a local maximum or minimum for a given function.
First Derivative Test
If is a critical number of a continuous function that is differentiable near (except possibly at ), then has a relative maximum at if and only 1 if changes sign from positive to negative at and has a relative minimum at if and only if changes sign from negative to positive at
Example
Let be a function whose derivative is given by the formula Determine all critical numbers of and decide whether a relative maximum, relative minimum, or neither occurs at each.
- Answer
-
Since we already have written in factored form, it is straightforward to find the critical numbers of Because is defined for all values of we need only determine where From the equation
and the zero product property, it follows that and are critical numbers of (There is no value of that makes )
Next, to apply the first derivative test, we'd like to know the sign of at inputs near the critical numbers. Because the critical numbers are the only locations at which can change sign, it follows that the sign of the derivative is the same on each of the intervals created by the critical numbers: for instance, the sign of must be the same for every We create a first derivative sign chart to summarize the sign of on the relevant intervals, along with the corresponding behavior of
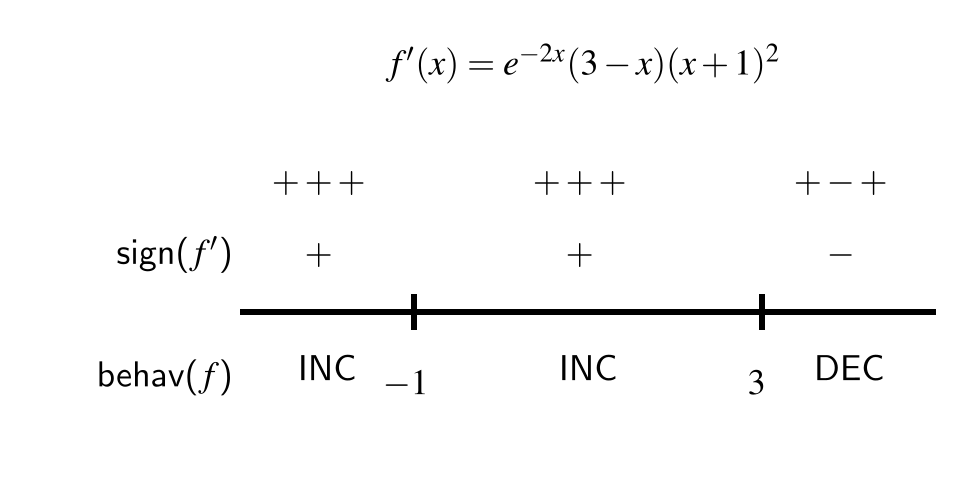
Figure . The first derivative sign chart for a function whose derivative is given by the formula To produce the first derivative sign chart in Figure we identify the sign of each factor of at one selected point in each interval. For instance, for we could determine the sign of and at the value We note that both and are positive regardless of the value of while is also positive at Hence, each of the three terms in is positive, which we indicate by writing “” Taking the product of three positive terms results in a positive value for which we denote by the “” in the interval to the left of And, since is positive on that interval, we know that is increasing, so we write “INC” to represent the behavior of In a similar way, we find that is positive and is increasing on and is negative and is decreasing for
Now we look for critical numbers at which changes sign. In this example, changes sign only at from positive to negative, so has a relative maximum at Although has a critical number at since is increasing both before and after has neither a minimum nor a maximum at
Activity
Suppose that is a function continuous for every value of whose first derivative is Further, assume that it is known that has a vertical asymptote at
- Determine all critical numbers of
- By developing a carefully labeled first derivative sign chart, decide whether has as a local maximum, local minimum, or neither at each critical number.
- Does have a global maximum? global minimum? Justify your claims.
- What is the value of What does the value of this limit tell you about the long-term behavior of
- Sketch a possible graph of
The second derivative test
Recall that the second derivative of a function tells us several important things about the behavior of the function itself. For instance, if is positive on an interval, then we know that is increasing on that interval and, consequently, that is concave up, so throughout that interval the tangent line to lies below the curve at every point. At a point where the sign of the second derivative determines whether has a local minimum or local maximum at the critical number
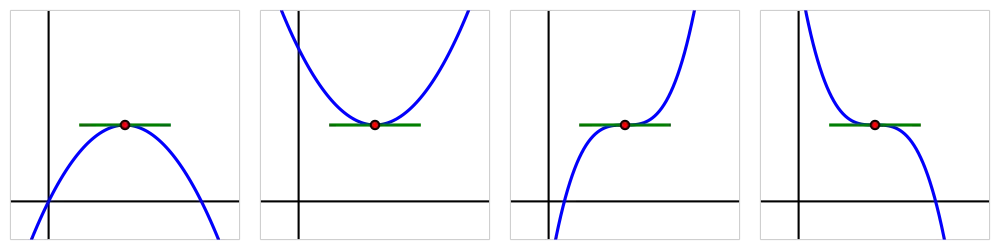
In Figure , we see the four possibilities for a function that has a critical number at which provided is not zero on an interval including (except possibly at ). On either side of the critical number, can be either positive or negative, and hence can be either concave up or concave down. In the first two graphs, does not change concavity at and in those situations, has either a local minimum or local maximum. In particular, if and then is concave down at with a horizontal tangent line, so has a local maximum there. This fact, along with the corresponding statement for when is positive, is the substance of the second derivative test.
Second Derivative Test
If is a critical number of a continuous function such that and then has a relative maximum at if and only if and has a relative minimum at if and only if
In the event that the second derivative test is inconclusive. That is, the test doesn't provide us any information. This is because if it is possible that has a local minimum, local maximum, or neither. 2
Just as a first derivative sign chart reveals all of the increasing and decreasing behavior of a function, we can construct a second derivative sign chart that demonstrates all of the important information involving concavity.
Example
Let be a function whose first derivative is Construct both first and second derivative sign charts for fully discuss where is increasing and decreasing and concave up and concave down, identify all relative extreme values, and sketch a possible graph of
- Answer
-
Since we know we can find the critical numbers of by solving Factoring, we observe that
so that are the three critical numbers of The first derivative sign chart for is given in Figure .
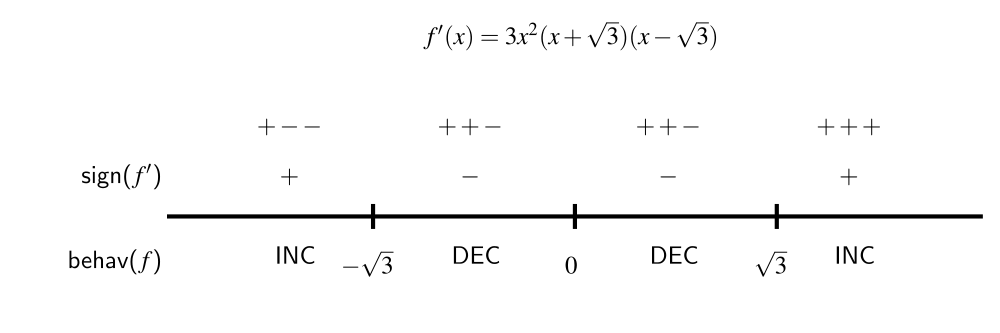
Figure . The first derivative sign chart for when We see that is increasing on the intervals and and is decreasing on and By the first derivative test, this information tells us that has a local maximum at and a local minimum at Although also has a critical number at neither a maximum nor minimum occurs there since does not change sign at
Next, we move on to investigate concavity. Differentiating we see that Since we are interested in knowing the intervals on which is positive and negative, we first find where Observe that
This equation has solutions Building a sign chart for in the exact same way we do for we see the result shown in Figure .
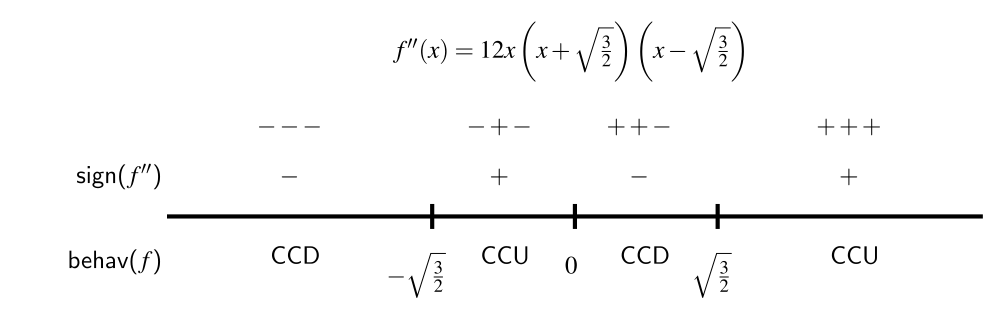
Figure . The second derivative sign chart for when Therefore, is concave down on the intervals and and concave up on and
Putting all of this information together, we now see a complete and accurate possible graph of in Figure .
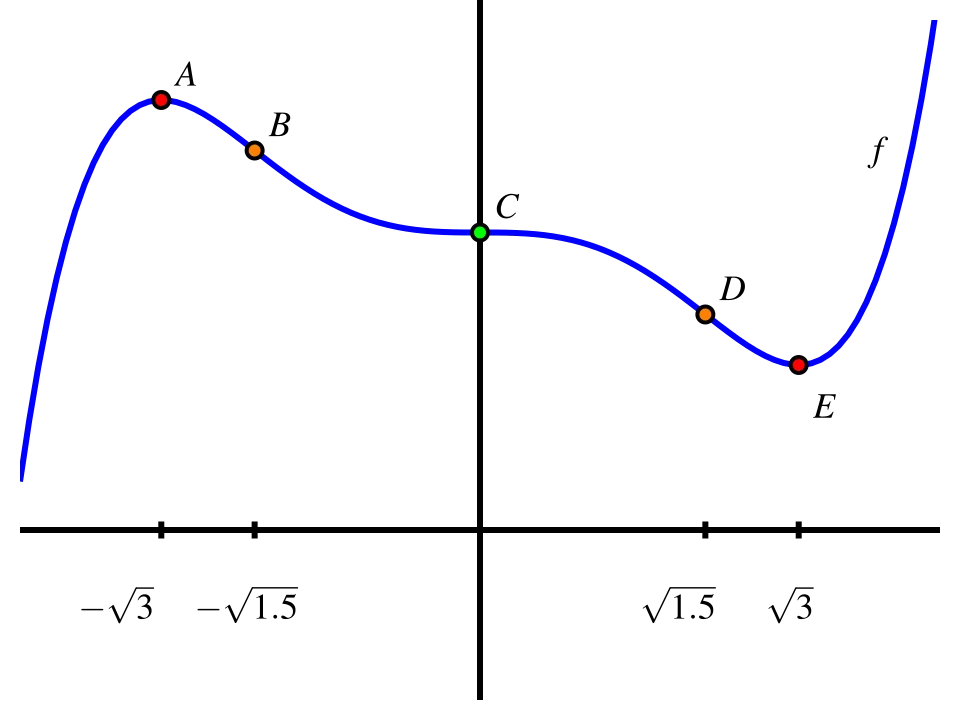
Figure . A possible graph of the function in Example 3.1.10. The point is a local maximum, because is increasing prior to and decreasing after; similarly, the point is a local minimum. Note, too, that is concave down at and concave up at which is consistent both with our second derivative sign chart and the second derivative test. At points and concavity changes, as we saw in the results of the second derivative sign chart in Figure . Finally, at point has a critical point with a horizontal tangent line, but neither a maximum nor a minimum occurs there, since is decreasing both before and after It is also the case that concavity changes at
While we completely understand where is increasing and decreasing, where is concave up and concave down, and where has relative extremes, we do not know any specific information about the -coordinates of points on the curve. For instance, while we know that has a local maximum at we don't know the value of that maximum because we do not know Any vertical translation of our sketch of in Figure would satisfy the given criteria for
Points and in Figure are locations at which the concavity of changes. We give a special name to any such point.
Definition
If is a value in the domain of a continuous function at which changes concavity, then we say that is an inflection point (or point of inflection) of
Just as we look for locations where changes from increasing to decreasing at points where or is undefined, so too we find where or is undefined to see if there are points of inflection at these locations.
At this point in our study, it is important to remind ourselves of the big picture that derivatives help to paint: the sign of the first derivative tells us whether the function is increasing or decreasing, while the sign of the second derivative tells us how the function is increasing or decreasing.
Activity
Suppose that is a function whose second derivative, is given by the graph in Figure .
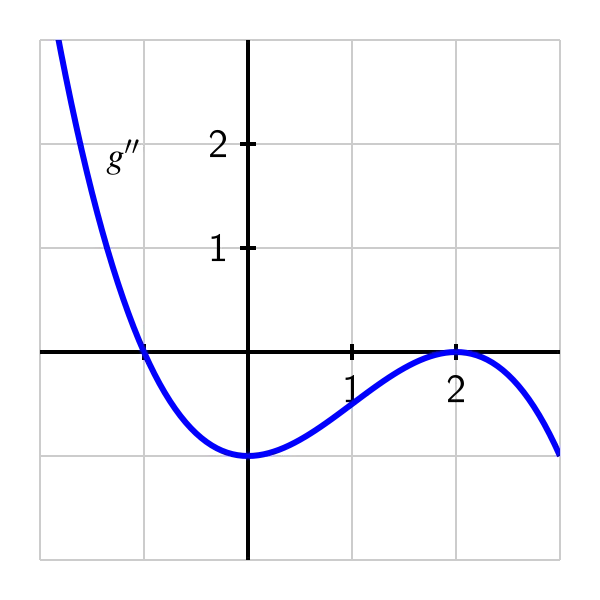
- Find the -coordinates of all points of inflection of
- Fully describe the concavity of by making an appropriate sign chart.
- Suppose you are given that Is there is a local maximum, local minimum, or neither (for the function ) at this critical number of or is it impossible to say? Why?
- Assuming that is a polynomial (and that all important behavior of is seen in the graph above), what degree polynomial do you think is? Why?
As we will see in more detail in the following section, derivatives also help us to understand families of functions that differ only by changing one or more parameters. For instance, we might be interested in understanding the behavior of all functions of the form where and are parameters. Each parameter has considerable impact on how the graph appears.
Activity
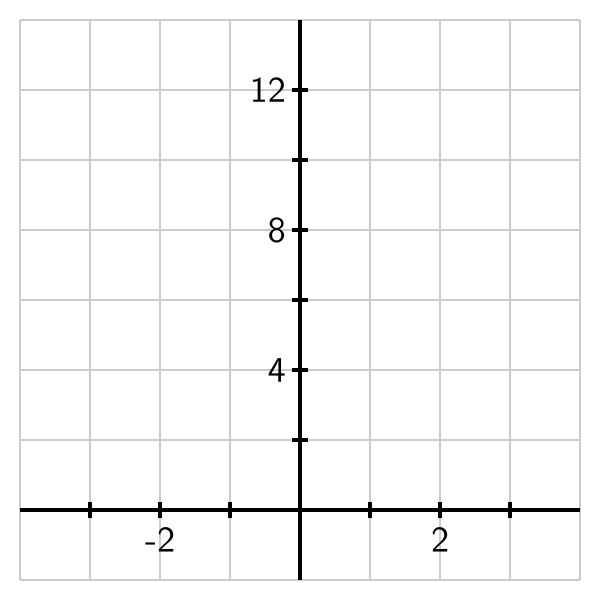
Consider the family of functions given by where is an arbitrary positive real number.
a. Use a graphing utility to sketch the graph of for several different -values, including Plot on the axes provided. What is the smallest value of at which you think you can see (just by looking at the graph) at least one inflection point on the graph of
b. Explain why the graph of has no inflection points if but infinitely many inflection points if
c. Explain why, no matter the value of can only have finitely many critical numbers.
Summary
- The critical numbers of a continuous function are the values of for which or does not exist. These values are important because they identify horizontal tangent lines or corner points on the graph, which are the only possible locations at which a local maximum or local minimum can occur.
- Given a differentiable function whenever is positive, is increasing; whenever is negative, is decreasing. The first derivative test tells us that at any point where changes from increasing to decreasing, has a local maximum, while conversely at any point where changes from decreasing to increasing has a local minimum.
- Given a twice differentiable function if we have a horizontal tangent line at and is nonzero, the sign of tells us the concavity of and hence whether has a maximum or minimum at In particular, if and then is concave down at and has a local maximum there, while if and then has a local minimum at If and then the second derivative does not tell us whether has a local extreme at or not.