this section we consider a difference in two population means, , under the condition that the data are not paired. Just as with a single sample, we identify conditions to ensure we can use the -distribution with a point estimate of the difference, , and a new standard error formula. Other than these two differences, the details are almost identical to the one-mean procedures.
We apply these methods in three contexts: determining whether stem cells can improve heart function, exploring the relationship between pregnant womens’ smoking habits and birth weights of newborns, and exploring whether there is statistically significant evidence that one variation of an exam is harder than another variation. This section is motivated by questions like “Is there convincing evidence that newborns from mothers who smoke have a different average birth weight than newborns from mothers who don’t smoke?”
Confidence interval for a difference of means
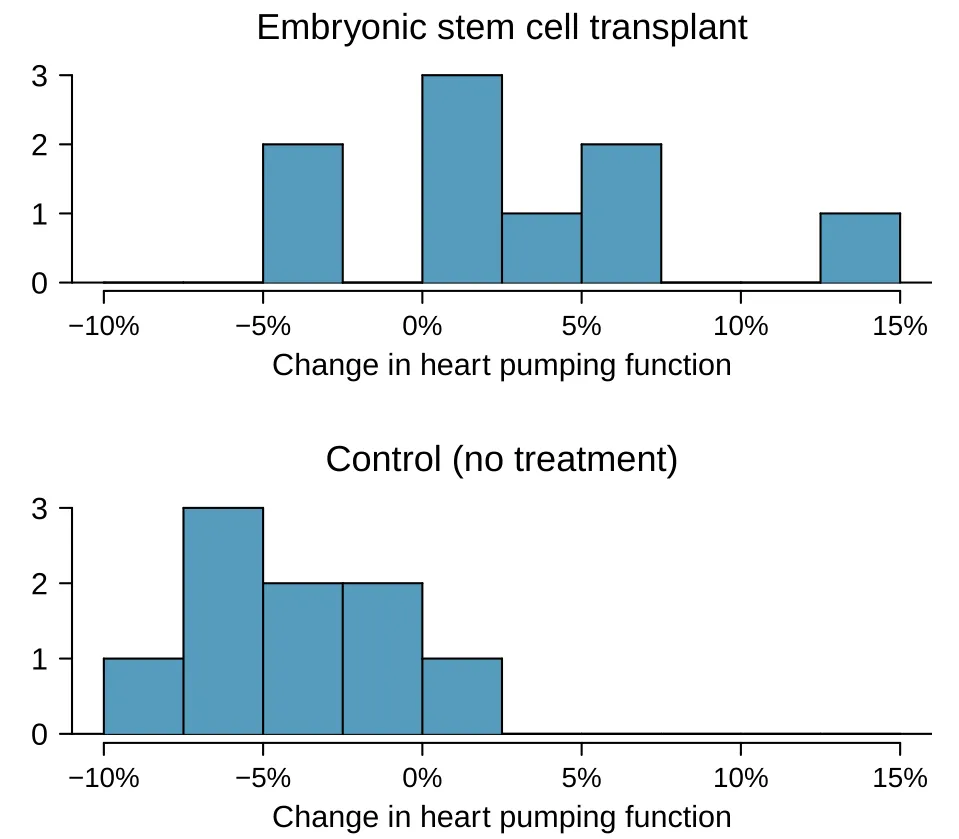
Does treatment using embryonic stem cells (ESCs) help improve heart function following a heart attack? Figure 7.11 contains summary statistics for an experiment to test ESCs in sheep that had a heart attack. Each of these sheep was randomly assigned to the ESC or control group, and the change in their hearts’ pumping capacity was measured in the study. Figure 7.12 provides histograms of the two data sets. A positive value corresponds to increased pumping capacity, which generally suggests a stronger recovery. Our goal will be to identify a 95% confidence interval for the effect of ESCs on the change in heart pumping capacity relative to the control group.
| ESCs | 9 | 3.50 | 5.17 | ||
| control | 9 | -4.33 | 2.76 |
The point estimate of the difference in the heart pumping variable is straightforward to find: it is the difference in the sample means. For the question of whether we can model this difference using a -distribution, we’ll need to check new conditions. Like the 2-proportion cases, we will require a more robust version of independence so we are confident the two groups are also independent. Secondly, we also check for normality in each group separately, which in practice is a check for outliers.
Using the -distribution for a difference in means
The -distribution can be used for inference when working with the standardized difference of two means if
Independence, extended. The data are independent within and between the two groups, e.g. the data come from independent random samples or from a randomized experiment.
Normality. We check the outliers rules of thumb for each group separately.
The standard error may be computed as The official formula for the degrees of freedom is quite complex and is generally computed using software, so instead you may use the smaller of and for the degrees of freedom if software isn’t readily available.
Example 7.21
Can the -distribution be used to make inference using the point estimate, ?
First, we check for independence. Because the sheep were randomized into the groups, independence within and between groups is satisfied.
Figure 7.12 does not reveal any clear outliers in either group. (The ESC group does look a bit more variability, but this is not the same as having clear outliers.)
With both conditions met, we can use the -distribution to model the difference of sample means.
As with the one-sample case, we always compute the standard error using sample standard deviations rather than population standard deviations: Generally, we use statistical software to find the appropriate degrees of freedom, or if software isn’t available, we can use the smaller of and for the degrees of freedom, e.g. if using a -table to find tail areas. For transparency in the Examples and Guided Practice, we’ll use the latter approach for finding ; in the case of the ESC example, this means we’ll use .
Example 7.22
Calculate a 95% confidence interval for the effect of ESCs on the change in heart pumping capacity of sheep after they’ve suffered a heart attack.
We will use the sample difference and the standard error that we computed earlier calculations: Using , we can identify the critical value of for a 95% confidence interval. Finally, we can enter the values into the confidence interval formula: We are 95% confident that embryonic stem cells improve the heart’s pumping function in sheep that have suffered a heart attack by 3.32% to 12.34%.
with past statistical inference applications, there is a well-trodden procedure.
- Prepare.
-
Retrieve critical contextual information, and if appropriate, set up hypotheses.
- Check.
-
Ensure the required conditions are reasonably satisfied.
- Calculate.
-
Find the standard error, and then construct a confidence interval, or if conducting a hypothesis test, find a test statistic and p-value.
- Conclude.
-
Interpret the results in the context of the application.
The details change a little from one setting to the next, but this general approach remain the same.
Hypothesis tests for the difference of two means
A data set called ncbirths represents a random sample of 150 cases of mothers and their newborns in North Carolina over a year. Four cases from this data set are represented in Figure 7.13. We are particularly interested in two variables: weight and smoke. The weight variable represents the weights of the newborns and the smoke variable describes which mothers smoked during pregnancy. We would like to know, is there convincing evidence that newborns from mothers who smoke have a different average birth weight than newborns from mothers who don’t smoke? We will use the North Carolina sample to try to answer this question. The smoking group includes 50 cases and the nonsmoking group contains 100 cases.
| fage | mage | weeks | weight | sex | smoke | |
|---|---|---|---|---|---|---|
| 1 | NA | 13 | 37 | 5.00 | female | nonsmoker |
| 2 | NA | 14 | 36 | 5.88 | female | nonsmoker |
| 3 | 19 | 15 | 41 | 8.13 | male | smoker |
| 150 | 45 | 50 | 36 | 9.25 | female | nonsmoker |
ncbirths data set. The value “NA”, shown for the first two entries of the first variable, indicates that piece of data is missing.Example 7.23
Set up appropriate hypotheses to evaluate whether there is a relationship between a mother smoking and average birth weight.
The null hypothesis represents the case of no difference between the groups.
There is no difference in average birth weight for newborns from mothers who did and did not smoke. In statistical notation: , where represents non-smoking mothers and represents mothers who smoked.
There is some difference in average newborn weights from mothers who did and did not smoke ().
We check the two conditions necessary to model the difference in sample means using the -distribution.
Because the data come from a simple random sample, the observations are independent, both within and between samples.
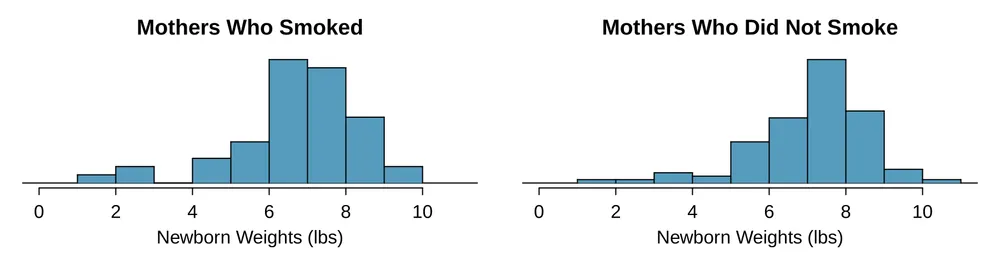
With both data sets over 30 observations, we inspect the data in Figure 7.14 for any particularly extreme outliers and find none.
Since both conditions are satisfied, the difference in sample means may be modeled using a -distribution.
Guided Practice 7.24
The summary statistics in Figure 7.15 may be useful for this Guided Practice.1
What is the point estimate of the population difference, ?
Compute the standard error of the point estimate from part (a).
smoker |
nonsmoker |
|
|---|---|---|
| mean | 6.78 | 7.18 |
| st. dev. | 1.43 | 1.60 |
| samp. size | 50 | 100 |
ncbirths data set.Example 7.25
Complete the hypothesis test started in Example 7.23 and Guided Practice 7.24. Use a significance level of . For reference, , , and the sample sizes were and .
We can find the test statistic for this test using the values from Guided Practice 7.24: The p-value is represented by the two shaded tails in the following plot:
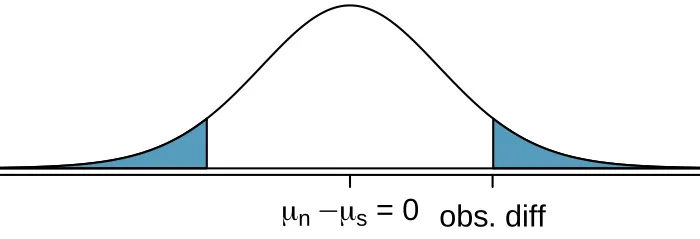
We find the single tail area using software (or the -table in Appendix C.2). We’ll use the smaller of and as the degrees of freedom: . The one tail area is 0.065; doubling this value gives the two-tail area and p-value, 0.135.
The p-value is larger than the significance value, 0.05, so we do not reject the null hypothesis. There is insufficient evidence to say there is a difference in average birth weight of newborns from North Carolina mothers who did smoke during pregnancy and newborns from North Carolina mothers who did not smoke during pregnancy.
Guided Practice 7.26
We’ve seen much research suggesting smoking is harmful during pregnancy, so how could we fail to reject the null hypothesis in Example 7.25? 2
Guided Practice 7.27
If we made a Type 2 Error and there is a difference, what could we have done differently in data collection to be more likely to detect the difference?3
Public service announcement: while we have used this relatively small data set as an example, larger data sets show that women who smoke tend to have smaller newborns. In fact, some in the tobacco industry actually had the audacity to tout that as a benefit of smoking:
It’s true. The babies born from women who smoke are smaller, but they’re just as healthy as the babies born from women who do not smoke. And some women would prefer having smaller babies.
- Joseph Cullman, Philip Morris’ Chairman of the Board
on CBS’ Face the Nation, Jan 3, 1971
Fact check: the babies from women who smoke are not actually as healthy as the babies from women who do not smoke.4
Case study: two versions of a course exam
An instructor decided to run two slight variations of the same exam. Prior to passing out the exams, she shuffled the exams together to ensure each student received a random version. Summary statistics for how students performed on these two exams are shown in Figure 7.16. Anticipating complaints from students who took Version B, she would like to evaluate whether the difference observed in the groups is so large that it provides convincing evidence that Version B was more difficult (on average) than Version A.
| Version | min | max | |||
|---|---|---|---|---|---|
| A | 30 | 79.4 | 14 | 45 | 100 |
| B | 27 | 74.1 | 20 | 32 | 100 |
Guided Practice 7.28
Construct hypotheses to evaluate whether the observed difference in sample means, , is due to chance. We will later evaluate these hypotheses using .5
Guided Practice 7.29
To evaluate the hypotheses in Guided Practice 7.28 using the -distribution, we must first verify conditions.6
Does it seem reasonable that the scores are independent?
Any concerns about outliers?
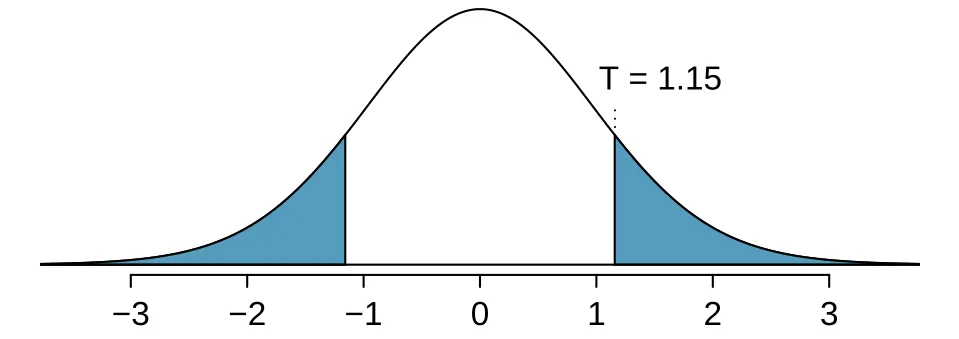
After verifying the conditions for each sample and confirming the samples are independent of each other, we are ready to conduct the test using the -distribution. In this case, we are estimating the true difference in average test scores using the sample data, so the point estimate is . The standard error of the estimate can be calculated as Finally, we construct the test statistic: If we have a computer handy, we can identify the degrees of freedom as 45.97. Otherwise we use the smaller of and : .
Example 7.30
Identify the p-value depicted in Figure 7.17 using , and provide a conclusion in the context of the case study.
Using software, we can find the one-tail area (0.13) and then double this value to get the two-tail area, which is the p-value: 0.26. (Alternatively, we could use the -table in Appendix C.2.)
In Guided Practice 7.28, we specified that we would use . Since the p-value is larger than , we do not reject the null hypothesis. That is, the data do not convincingly show that one exam version is more difficult than the other, and the teacher should not be convinced that she should add points to the Version B exam scores.
Pooled standard deviation estimate (special topic)
Occasionally, two populations will have standard deviations that are so similar that they can be treated as identical. For example, historical data or a well-understood biological mechanism may justify this strong assumption. In such cases, we can make the -distribution approach slightly more precise by using a pooled standard deviation.
The pooled standard deviation of two groups is a way to use data from both samples to better estimate the standard deviation and standard error. If and are the standard deviations of groups 1 and 2 and there are very good reasons to believe that the population standard deviations are equal, then we can obtain an improved estimate of the group variances by pooling their data: where and are the sample sizes, as before. To use this new statistic, we substitute in place of and in the standard error formula, and we use an updated formula for the degrees of freedom:
The benefits of pooling the standard deviation are realized through obtaining a better estimate of the standard deviation for each group and using a larger degrees of freedom parameter for the -distribution. Both of these changes may permit a more accurate model of the sampling distribution of , if the standard deviations of the two groups are indeed equal.
Pool standard deviations only after careful consideration
A pooled standard deviation is only appropriate when background research indicates the population standard deviations are nearly equal. When the sample size is large and the condition may be adequately checked with data, the benefits of pooling the standard deviations greatly diminishes.
Exercises
Exercise 7.23
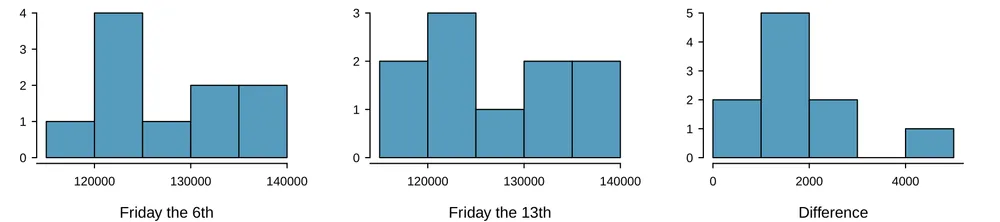
Friday the 13, Part I. In the early 1990’s, researchers in the UK collected data on traffic flow, number of shoppers, and traffic accident related emergency room admissions on Friday the 13 and the previous Friday, Friday the 6. The histograms below show the distribution of number of cars passing by a specific intersection on Friday the 6 and Friday the 13 for many such date pairs. Also given are some sample statistics, where the difference is the number of cars on the 6th minus the number of cars on the 13th.7
| 6 | 13 | Diff. | |
|---|---|---|---|
| 128,385 | 126,550 | 1,835 | |
| 7,259 | 7,664 | 1,176 | |
| 10 | 10 | 10 |
Are there any underlying structures in these data that should be considered in an analysis? Explain.
What are the hypotheses for evaluating whether the number of people out on Friday the 6 is different than the number out on Friday the 13?
Check conditions to carry out the hypothesis test from part (b).
Calculate the test statistic and the p-value.
What is the conclusion of the hypothesis test?
Interpret the p-value in this context.
What type of error might have been made in the conclusion of your test? Explain.
Exercise 7.24
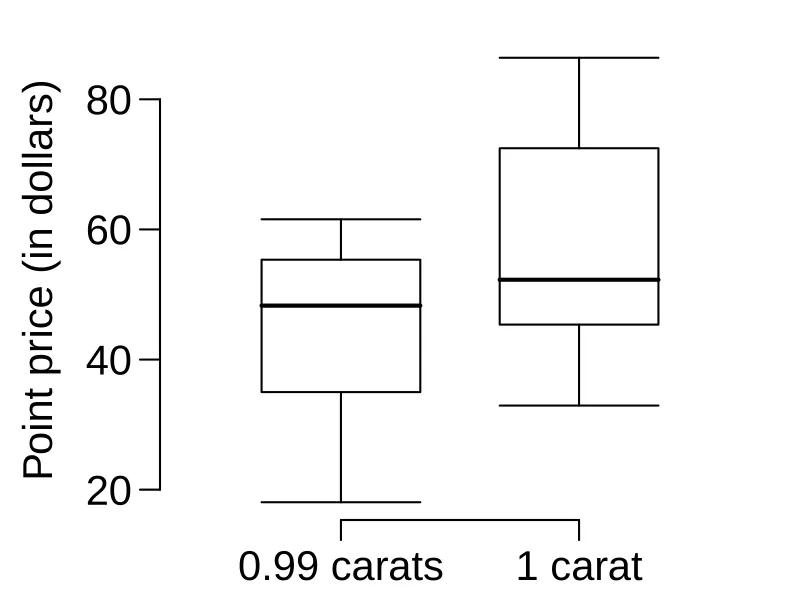
Diamonds, Part I. Prices of diamonds are determined by what is known as the 4 Cs: cut, clarity, color, and carat weight. The prices of diamonds go up as the carat weight increases, but the increase is not smooth. For example, the difference between the size of a 0.99 carat diamond and a 1 carat diamond is undetectable to the naked human eye, but the price of a 1 carat diamond tends to be much higher than the price of a 0.99 diamond. In this question we use two random samples of diamonds, 0.99 carats and 1 carat, each sample of size 23, and compare the average prices of the diamonds. In order to be able to compare equivalent units, we first divide the price for each diamond by 100 times its weight in carats. That is, for a 0.99 carat diamond, we divide the price by 99. For a 1 carat diamond, we divide the price by 100. The distributions and some sample statistics are shown below.8
Conduct a hypothesis test to evaluate if there is a difference between the average standardized prices of 0.99 and 1 carat diamonds. Make sure to state your hypotheses clearly, check relevant conditions, and interpret your results in context of the data.
| 0.99 carats | 1 carat | |
|---|---|---|
| Mean | $44.51 | $56.81 |
| SD | $13.32 | $16.13 |
| n | 23 | 23 |
Exercise 7.25
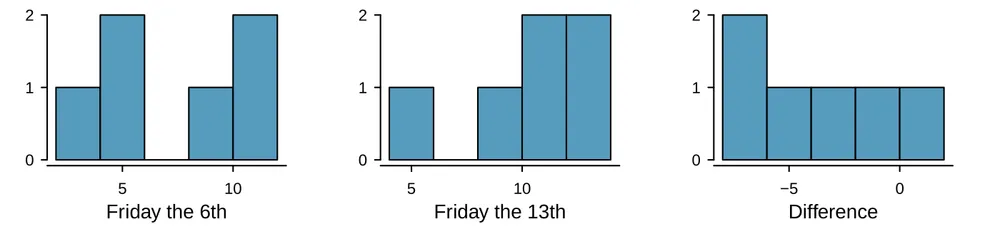
Friday the 13, Part II. The Friday the study reported in Exercise 7.23 also provides data on traffic accident related emergency room admissions. The distributions of these counts from Friday the 6 and Friday the 13 are shown below for six such paired dates along with summary statistics. You may assume that conditions for inference are met.
| 6 | 13 | diff | |
|---|---|---|---|
| Mean | 7.5 | 10.83 | -3.33 |
| SD | 3.33 | 3.6 | 3.01 |
| n | 6 | 6 | 6 |
Conduct a hypothesis test to evaluate if there is a difference between the average numbers of traffic accident related emergency room admissions between Friday the 6 and Friday the 13.
Calculate a 95% confidence interval for the difference between the average numbers of traffic accident related emergency room admissions between Friday the 6 and Friday the 13.
The conclusion of the original study states, “Friday 13th is unlucky for some. The risk of hospital admission as a result of a transport accident may be increased by as much as 52%. Staying at home is recommended.” Do you agree with this statement? Explain your reasoning.
Exercise 7.26
Diamonds, Part II. In Exercise 7.24, we discussed diamond prices (standardized by weight) for diamonds with weights 0. 99 carats and 1 carat. See the table for summary statistics, and then construct a 95% confidence interval for the average difference between the standardized prices of 0.99 and 1 carat diamonds. You may assume the conditions for inference are met.
| 0.99 carats | 1 carat | |
|---|---|---|
| Mean | $44.51 | $56.81 |
| SD | $13.32 | $16.13 |
| n | 23 | 23 |
Exercise 7.27
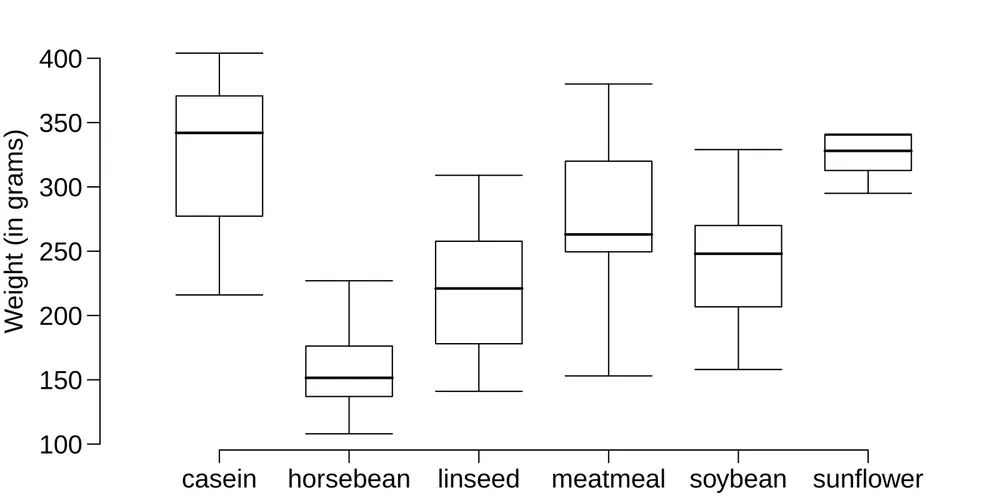
Chicken diet and weight, Part I. Chicken farming is a multi-billion dollar industry, and any methods that increase the growth rate of young chicks can reduce consumer costs while increasing company profits, possibly by millions of dollars. An experiment was conducted to measure and compare the effectiveness of various feed supplements on the growth rate of chickens. Newly hatched chicks were randomly allocated into six groups, and each group was given a different feed supplement. Below are some summary statistics from this data set along with box plots showing the distribution of weights by feed type.9
| Mean | SD | n | |
|---|---|---|---|
| casein | 323.58 | 64.43 | 12 |
| horsebean | 160.20 | 38.63 | 10 |
| linseed | 218.75 | 52.24 | 12 |
| meatmeal | 276.91 | 64.90 | 11 |
| soybean | 246.43 | 54.13 | 14 |
| sunflower | 328.92 | 48.84 | 12 |
Describe the distributions of weights of chickens that were fed linseed and horsebean.
Do these data provide strong evidence that the average weights of chickens that were fed linseed and horsebean are different? Use a 5% significance level.
What type of error might we have committed? Explain.
Would your conclusion change if we used ?
Exercise 7.28
Fuel efficiency of manual and automatic cars, Part I. Each year the US Environmental Protection Agency (EPA) releases fuel economy data on cars manufactured in that year. Below are summary statistics on fuel efficiency (in miles/gallon) from random samples of cars with manual and automatic transmissions. Do these data provide strong evidence of a difference between the average fuel efficiency of cars with manual and automatic transmissions in terms of their average city mileage? Assume that conditions for inference are satisfied. 10
| City MPG | ||
|---|---|---|
| Automatic | Manual | |
| Mean | 16.12 | 19.85 |
| SD | 3.58 | 4.51 |
| n | 26 | 26 |
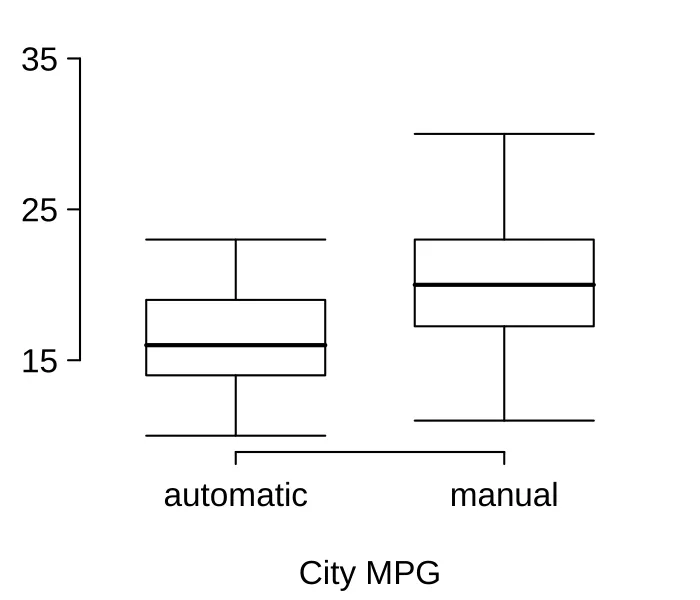
Exercise 7.29
Chicken diet and weight, Part II. Casein is a common weight gain supplement for humans. Does it have an effect on chickens? Using data provided in Exercise 7.27, test the hypothesis that the average weight of chickens that were fed casein is different than the average weight of chickens that were fed soybean. If your hypothesis test yields a statistically significant result, discuss whether or not the higher average weight of chickens can be attributed to the casein diet. Assume that conditions for inference are satisfied.
Exercise 7.30
Fuel efficiency of manual and automatic cars, Part II. The table provides summary statistics on highway fuel economy of the same 52 cars from Exercise 7.28. Use these statistics to calculate a 98% confidence interval for the difference between average highway mileage of manual and automatic cars, and interpret this interval in the context of the data.11
| Hwy MPG | ||
|---|---|---|
| Automatic | Manual | |
| Mean | 22.92 | 27.88 |
| SD | 5.29 | 5.01 |
| n | 26 | 26 |
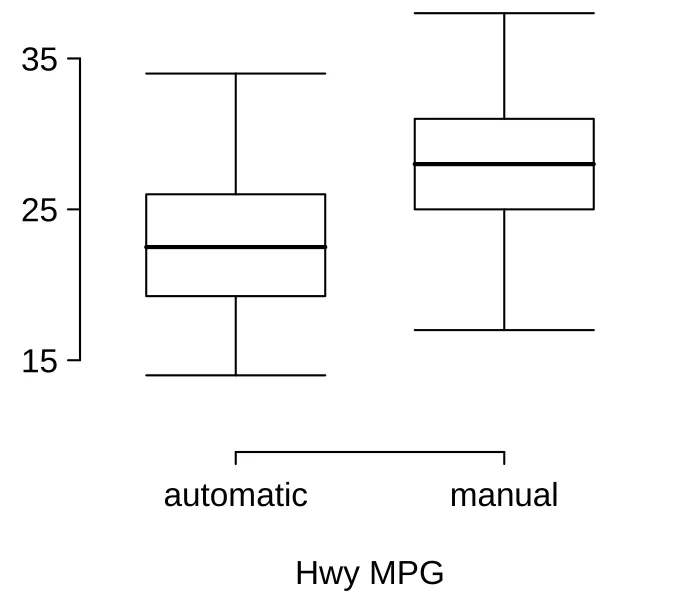
Exercise 7.31
Prison isolation experiment, Part I. Subjects from Central Prison in Raleigh, NC, volunteered for an experiment involving an “isolation” experience. The goal of the experiment was to find a treatment that reduces subjects’ psychopathic deviant T scores. This score measures a person’s need for control or their rebellion against control, and it is part of a commonly used mental health test called the Minnesota Multiphasic Personality Inventory (MMPI) test. The experiment had three treatment groups:
Four hours of sensory restriction plus a 15 minute “therapeutic" tape advising that professional help is available.
Four hours of sensory restriction plus a 15 minute “emotionally neutral” tape on training hunting dogs.
Four hours of sensory restriction but no taped message.
Forty-two subjects were randomly assigned to these treatment groups, and an MMPI test was administered before and after the treatment. Distributions of the differences between pre and post treatment scores (pre - post) are shown below, along with some sample statistics. Use this information to independently test the effectiveness of each treatment. Make sure to clearly state your hypotheses, check conditions, and interpret results in the context of the data.12
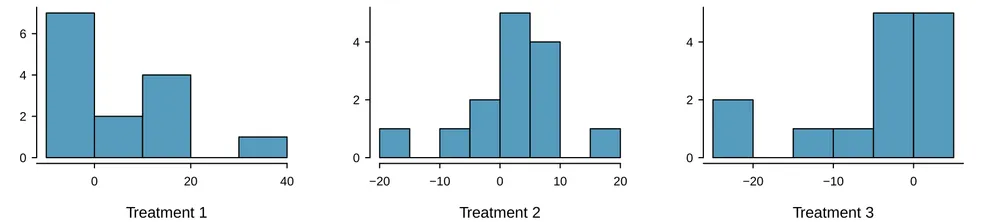
| Tr 1 | Tr 2 | Tr 3 | ||
|---|---|---|---|---|
| Mean | 6.21 | 2.86 | -3.21 | |
| SD | 12.3 | 7.94 | 8.57 | |
| n | 14 | 14 | 14 |
Exercise 7.32
True / False: comparing means. Determine if the following statements are true or false, and explain your reasoning for statements you identify as false.
When comparing means of two samples where and , we can use the normal model for the difference in means since .
As the degrees of freedom increases, the -distribution approaches normality.
We use a pooled standard error for calculating the standard error of the difference between means when sample sizes of groups are equal to each other.
Notes
(a) The difference in sample means is an appropriate point estimate: . (b) The standard error of the estimate can be calculated using the standard error formula: ↩
It is possible that there is a difference but we did not detect it. If there is a difference, we made a Type 2 Error. ↩
We could have collected more data. If the sample sizes are larger, we tend to have a better shot at finding a difference if one exists. In fact, this is exactly what we would find if we examined a larger data set! ↩
You can watch an episode of John Oliver on Last Week Tonight to explore the present day offenses of the tobacco industry. Please be aware that there is some adult language: youtu.be/6UsHHOCH4q8. ↩
: the exams are equally difficult, on average. . : one exam was more difficult than the other, on average. . ↩
(a) Since the exams were shuffled, the “treatment” in this case was randomly assigned, so independence within and between groups is satisfied. (b) The summary statistics suggest the data are roughly symmetric about the mean, and the min/max values don’t suggest any outliers of concern. ↩
Scanlon, T.J. et al. Is Friday the 13th Bad For Your Health?. BMJ. 1993. ↩
Wickham, H. ggplot2: elegant graphics for data analysis. Springer New York. 2009. ↩
Chicken Weights by Feed Type, from the
datasetspackage in R. ↩U.S. Department of Energy, Fuel Economy Data, 2012 Datafile. ↩
U.S. Department of Energy, Fuel Economy Data, 2012 Datafile. ↩
Prison isolation experiment, stat.duke.edu/resources/datasets/prison-isolation. ↩