There can be rich relationships between two or more variables that are useful to understand. For example a car insurance company will consider information about a person’s driving history to assess the risk that they will be responsible for an accident. These types of relationships are the realm of conditional probabilities.
Exploring probabilities with a contingency table
The photo_classify data set represents a classifier a sample of 1822 photos from a photo sharing website. Data scientists have been working to improve a classifier for whether the photo is about fashion or not, and these 1822 photos represent a test for their classifier. Each photo gets two classifications: the first is called mach_learn and gives a classification from a machine learning (ML) system of either pred_fashion or pred_not. Each of these 1822 photos have also been classified carefully by a team of people, which we take to be the source of truth; this variable is called truth and takes values fashion and not. Figure 3.11 summarizes the results.
truth |
||||||
fashion |
not |
Total | ||||
pred_fashion |
197 | 22 | 219 | |||
mach_learn |
pred_not |
112 | 1491 | 1603 | ||
| Total | 309 | 1513 | 1822 | |||
photo_classify data set.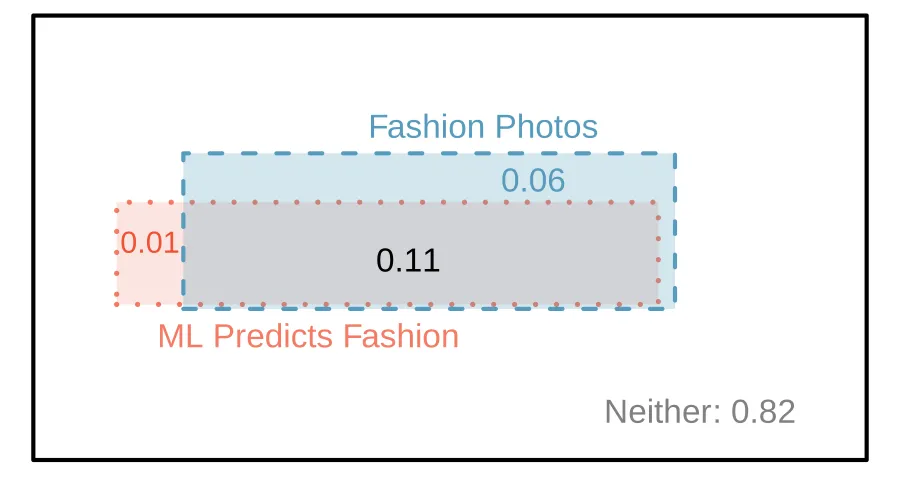
photo_classify data set.Example 3.26
If a photo is actually about fashion, what is the chance the ML classifier correctly identified the photo as being about fashion?
We can estimate this probability using the data. Of the 309 fashion photos, the ML algorithm correctly classified 197 of the photos:
Example 3.27
We sample a photo from the data set and learn the ML algorithm predicted this photo was not about fashion. What is the probability that it was incorrect and the photo is about fashion?
If the ML classifier suggests a photo is not about fashion, then it comes from the second row in the data set. Of these 1603 photos, 112 were actually about fashion:
Marginal and joint probabilities
Figure 3.11 includes row and column totals for each variable separately in the photo_classify data set. These totals represent marginal probabilities for the sample, which are the probabilities based on a single variable without regard to any other variables. For instance, a probability based solely on the mach_learn variable is a marginal probability: A probability of outcomes for two or more variables or processes is called a joint probability: It is common to substitute a comma for “and” in a joint probability, although using either the word “and” or a comma is acceptable:
means the same thing as
Marginal and joint probabilities
If a probability is based on a single variable, it is a marginal probability. The probability of outcomes for two or more variables or processes is called a joint probability.
We use table proportions to summarize joint probabilities for the photo_classify sample. These proportions are computed by dividing each count in Figure 3.11 by the table’s total, 1822, to obtain the proportions in Figure 3.13. The joint probability distribution of the mach_learn and truth variables is shown in Figure 3.14.
truth: fashion |
truth: not |
Total | |
|---|---|---|---|
mach_learn: pred_fashion |
0.1081 | 0.0121 | 0.1202 |
mach_learn: pred_not |
0.0615 | 0.8183 | 0.8798 |
| Total | 0.1696 | 0.8304 | 1.00 |
photo_classify data set.| Joint outcome | Probability |
|---|---|
mach_learn is pred_fashion and truth is fashion |
0.1081 |
mach_learn is pred_fashion and truth is not |
0.0121 |
mach_learn is pred_not and truth is fashion |
0.0615 |
mach_learn is pred_not and truth is not |
0.8183 |
| Total | 1.0000 |
photo_classify data set.Guided Practice 3.28
Verify Figure 3.14 represents a probability distribution: events are disjoint, all probabilities are non-negative, and the probabilities sum to 1.1
We can compute marginal probabilities using joint probabilities in simple cases. For example, the probability a randomly selected photo from the data set is about fashion is found by summing the outcomes where truth takes value fashion:
Defining conditional probability
The ML classifier predicts whether a photo is about fashion, even if it is not perfect. We would like to better understand how to use information from a variable like mach_learn to improve our probability estimation of a second variable, which in this example is truth.
The probability that a random photo from the data set is about fashion is about 0.17. If we knew the machine learning classifier predicted the photo was about fashion, could we get a better estimate of the probability the photo is actually about fashion? Absolutely. To do so, we limit our view to only those 219 cases where the ML classifier predicted that the photo was about fashion and look at the fraction where the photo was actually about fashion: We call this a conditional probability because we computed the probability under a condition: the ML classifier prediction said the photo was about fashion.
There are two parts to a conditional probability, the outcome of interest and the condition. It is useful to think of the condition as information we know to be true, and this information usually can be described as a known outcome or event. We generally separate the text inside our probability notation into the outcome of interest and the condition with a vertical bar: The vertical bar “” is read as given.
In the last equation, we computed the probability a photo was about fashion based on the condition that the ML algorithm predicted it was about fashion as a fraction: We considered only those cases that met the condition, mach_learn is pred_fashion, and then we computed the ratio of those cases that satisfied our outcome of interest, photo was actually about fashion.
Frequently, marginal and joint probabilities are provided instead of count data. For example, disease rates are commonly listed in percentages rather than in a count format. We would like to be able to compute conditional probabilities even when no counts are available, and we use the last equation as a template to understand this technique.
We considered only those cases that satisfied the condition, where the ML algorithm predicted fashion. Of these cases, the conditional probability was the fraction representing the outcome of interest, that the photo was about fashion. Suppose we were provided only the information in Figure 3.13, i.e. only probability data. Then if we took a sample of 1000 photos, we would anticipate about 12.0% or would be predicted to be about fashion (mach_learn is pred_fashion). Similarly, we would expect about 10.8% or to meet both the information criteria and represent our outcome of interest. Then the conditional probability can be computed as Here we are examining exactly the fraction of two probabilities, 0.108 and 0.120, which we can write as The fraction of these probabilities is an example of the general formula for conditional probability.
Conditional probability
The conditional probability of outcome given condition is computed as the following:
Guided Practice 3.29
(a) Write out the following statement in conditional probability notation: “The probability that the ML prediction was correct, if the photo was about fashion”. Here the condition is now based on the photo’s truth status, not the ML algorithm.
(b) Determine the probability from part (a). Table 3.13 may be helpful.2
Guided Practice 3.30
(a) Determine the probability that the algorithm is incorrect if it is known the photo is about fashion.
(b) Using the answers from part (a) and Guided Practice 3.29(b), compute (c) Provide an intuitive argument to explain why the sum in (b) is 1.3
Smallpox in Boston, 1721
The smallpox data set provides a sample of 6,224 individuals from the year 1721 who were exposed to smallpox in Boston. Doctors at the time believed that inoculation, which involves exposing a person to the disease in a controlled form, could reduce the likelihood of death.
Each case represents one person with two variables: inoculated and result. The variable inoculated takes two levels: yes or no, indicating whether the person was inoculated or not. The variable result has outcomes lived or died. These data are summarized in Tables 3.15 and 3.16.
| inoculated | ||||
yes |
no |
Total | ||
lived |
238 | 5136 | 5374 | |
result |
died |
6 | 844 | 850 |
| Total | 244 | 5980 | 6224 | |
smallpox data set.| inoculated | ||||
yes |
no |
Total | ||
lived |
0.0382 | 0.8252 | 0.8634 | |
result |
died |
0.0010 | 0.1356 | 0.1366 |
| Total | 0.0392 | 0.9608 | 1.0000 | |
smallpox data, computed by dividing each count by the table total, 6224.Guided Practice 3.31
Write out, in formal notation, the probability a randomly selected person who was not inoculated died from smallpox, and find this probability.4
Guided Practice 3.32
Determine the probability that an inoculated person died from smallpox. How does this result compare with the result of Guided Practice 3.31?5
Guided Practice 3.33
The people of Boston self-selected whether or not to be inoculated. (a) Is this study observational or was this an experiment? (b) Can we infer any causal connection using these data? (c) What are some potential confounding variables that might influence whether someone lived or died and also affect whether that person was inoculated?6
General multiplication rule
Section 3.1.7 introduced the Multiplication Rule for independent processes. Here we provide the General Multiplication Rule for events that might not be independent.
General Multiplication Rule
If and represent two outcomes or events, then
It is useful to think of as the outcome of interest and as the condition.
General Multiplication Rule is simply a rearrangement of the conditional probability equation.
Example 3.34
Consider the smallpox data set. Suppose we are given only two pieces of information: 96.08% of residents were not inoculated, and 85.88% of the residents who were not inoculated ended up surviving. How could we compute the probability that a resident was not inoculated and lived?
We will compute our answer using the General Multiplication Rule and then verify it using Figure 3.16. We want to determine and we are given that Among the 96.08% of people who were not inoculated, 85.88% survived: This is equivalent to the General Multiplication Rule. We can confirm this probability in Figure 3.16 at the intersection of no and lived (with a small rounding error).
Guided Practice 3.35
Use inoculated = yes and result = lived inoculated = yes to determine the probability that a person was both inoculated and lived.7
Guided Practice 3.36
If 97.54% of the inoculated people lived, what proportion of inoculated people must have died?8
Sum of conditional probabilities
Let , ..., represent all the disjoint outcomes for a variable or process. Then if is an event, possibly for another variable or process, we have:
The rule for complements also holds when an event and its complement are conditioned on the same information:
Guided Practice 3.37
Based on the probabilities computed above, does it appear that inoculation is effective at reducing the risk of death from smallpox?9
Independence considerations in conditional probability
If two events are independent, then knowing the outcome of one should provide no information about the other. We can show this is mathematically true using conditional probabilities.
Guided Practice 3.38
Let and represent the outcomes of rolling two dice.10
What is the probability that the first die, , is
1?What is the probability that both and are
1?Use the formula for conditional probability to compute
11.What is ? Is this different from the answer from part (c)? Explain.
We can show in Guided Practice 3.38(c) that the conditioning information has no influence by using the Multiplication Rule for independence processes:
Guided Practice 3.39
Ron is watching a roulette table in a casino and notices that the last five outcomes were black. He figures that the chances of getting black six times in a row is very small (about ) and puts his paycheck on red. What is wrong with his reasoning?11
Tree diagrams
Tree diagrams are a tool to organize outcomes and probabilities around the structure of the data. They are most useful when two or more processes occur in a sequence and each process is conditioned on its predecessors.
The smallpox data fit this description. We see the population as split by inoculation: yes and no. Following this split, survival rates were observed for each group. This structure is reflected in the tree diagram shown in Figure 3.17. The first branch for inoculation is said to be the primary branch while the other branches are secondary.
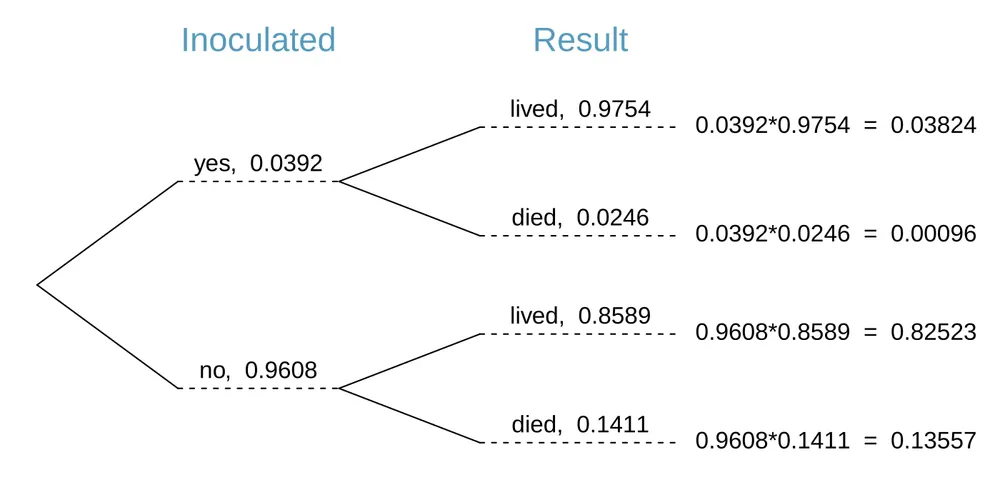
smallpox data set.Tree diagrams are annotated with marginal and conditional probabilities, as shown in Figure 3.17. This tree diagram splits the smallpox data by inoculation into the yes and no groups with respective marginal probabilities 0.0392 and 0.9608. The secondary branches are conditioned on the first, so we assign conditional probabilities to these branches. For example, the top branch in Figure 3.17 is the probability that result = lived conditioned on the information that inoculated = yes. We may (and usually do) construct joint probabilities at the end of each branch in our tree by multiplying the numbers we come across as we move from left to right. These joint probabilities are computed using the General Multiplication Rule:
Example 3.40
Consider the midterm and final for a statistics class. Suppose 13% of students earned an A on the midterm. Of those students who earned an A on the midterm, 47% received an A on the final, and 11% of the students who earned lower than an A on the midterm received an A on the final. You randomly pick up a final exam and notice the student received an A. What is the probability that this student earned an A on the midterm?
The end-goal is to find . To calculate this conditional probability, we need the following probabilities: However, this information is not provided, and it is not obvious how to calculate these probabilities. Since we aren’t sure how to proceed, it is useful to organize the information into a tree diagram:
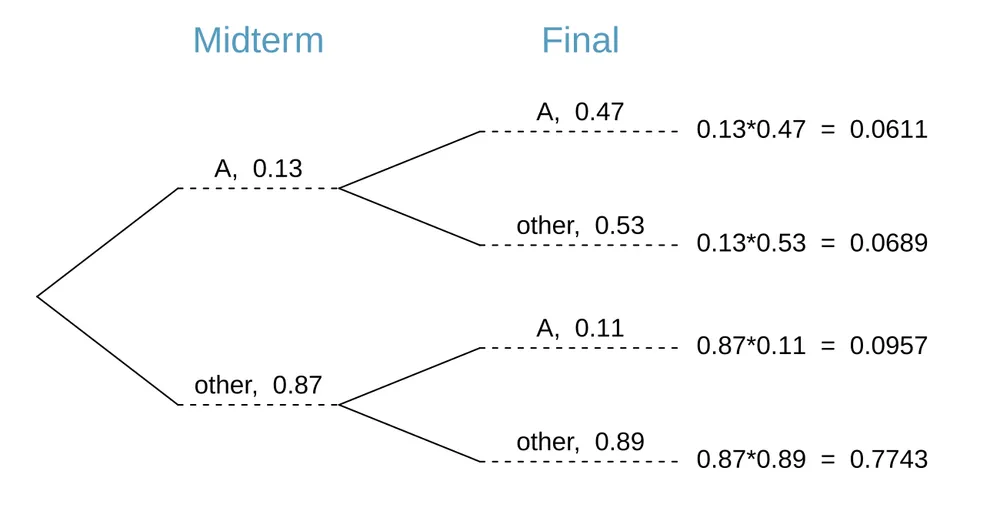
When constructing a tree diagram, variables provided with marginal probabilities are often used to create the tree’s primary branches; in this case, the marginal probabilities are provided for midterm grades. The final grades, which correspond to the conditional probabilities provided, will be shown on the secondary branches.
With the tree diagram constructed, we may compute the required probabilities: The marginal probability, final = A, was calculated by adding up all the joint probabilities on the right side of the tree that correspond to final = A. We may now finally take the ratio of the two probabilities: The probability the student also earned an A on the midterm is about 0.39.
Guided Practice 3.41
After an introductory statistics course, 78% of students can successfully construct tree diagrams. Of those who can construct tree diagrams, 97% passed, while only 57% of those students who could not construct tree diagrams passed. (a) Organize this information into a tree diagram. (b) What is the probability that a randomly selected student passed? (c) Compute the probability a student is able to construct a tree diagram if it is known that she passed.12
Bayes’ Theorem
In many instances, we are given a conditional probability of the form but we would really like to know the inverted conditional probability: Tree diagrams can be used to find the second conditional probability when given the first. However, sometimes it is not possible to draw the scenario in a tree diagram. In these cases, we can apply a very useful and general formula: Bayes’ Theorem.
We first take a critical look at an example of inverting conditional probabilities where we still apply a tree diagram.
Example 3.42
In Canada, about 0.35% of women over 40 will develop breast cancer in any given year. A common screening test for cancer is the mammogram, but this test is not perfect. In about 11% of patients with breast cancer, the test gives a false negative: it indicates a woman does not have breast cancer when she does have breast cancer. Similarly, the test gives a false positive in 7% of patients who do not have breast cancer: it indicates these patients have breast cancer when they actually do not. If we tested a random woman over 40 for breast cancer using a mammogram and the test came back positive – that is, the test suggested the patient has cancer – what is the probability that the patient actually has breast cancer?
Notice that we are given sufficient information to quickly compute the probability of testing positive if a woman has breast cancer (). However, we seek the inverted probability of cancer given a positive test result. (Watch out for the non-intuitive medical language: a positive test result suggests the possible presence of cancer in a mammogram screening.) This inverted probability may be broken into two pieces: where “has BC” is an abbreviation for the patient having breast cancer and “mammogram” means the mammogram screening was positive. We can construct a tree diagram for these probabilities:
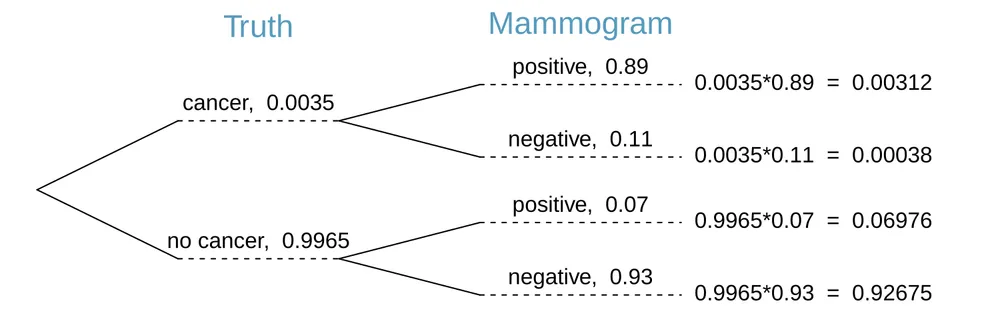
The probability the patient has breast cancer and the mammogram is positive is The probability of a positive test result is the sum of the two corresponding scenarios: Then if the mammogram screening is positive for a patient, the probability the patient has breast cancer is That is, even if a patient has a positive mammogram screening, there is still only a 4% chance that she has breast cancer.
Example 3.42 highlights why doctors often run more tests regardless of a first positive test result. When a medical condition is rare, a single positive test isn’t generally definitive.
Consider again the last equation of Example 3.42. Using the tree diagram, we can see that the numerator (the top of the fraction) is equal to the following product: The denominator – the probability the screening was positive – is equal to the sum of probabilities for each positive screening scenario: In the example, each of the probabilities on the right side was broken down into a product of a conditional probability and marginal probability using the tree diagram. We can see an application of Bayes’ Theorem by substituting the resulting probability expressions into the numerator and denominator of the original conditional probability.
Bayes’ Theorem: inverting probabilities
Consider the following conditional probability for variable 1 and variable 2: Bayes’ Theorem states that this conditional probability can be identified as the following fraction: where , , ..., and represent all other possible outcomes of the first variable.
Bayes’ Theorem is a generalization of what we have done using tree diagrams. The numerator identifies the probability of getting both and . The denominator is the marginal probability of getting . This bottom component of the fraction appears long and complicated since we have to add up probabilities from all of the different ways to get . We always completed this step when using tree diagrams. However, we usually did it in a separate step so it didn’t seem as complex.
apply Bayes’ Theorem correctly, there are two preparatory steps:
First identify the marginal probabilities of each possible outcome of the first variable: , , ..., .
Then identify the probability of the outcome , conditioned on each possible scenario for the first variable: , , ..., .
Once each of these probabilities are identified, they can be applied directly within the formula. Bayes’ Theorem tends to be a good option when there are so many scenarios that drawing a tree diagram would be complex.
Guided Practice 3.43
Jose visits campus every Thursday evening. However, some days the parking garage is full, often due to college events. There are academic events on 35% of evenings, sporting events on 20% of evenings, and no events on 45% of evenings. When there is an academic event, the garage fills up about 25% of the time, and it fills up 70% of evenings with sporting events. On evenings when there are no events, it only fills up about 5% of the time. If Jose comes to campus and finds the garage full, what is the probability that there is a sporting event? Use a tree diagram to solve this problem.13
Example 3.44
Here we solve the same problem presented in Guided Practice 3.43, except this time we use Bayes’ Theorem.
The outcome of interest is whether there is a sporting event (call this ), and the condition is that the lot is full (). Let represent an academic event and represent there being no event on campus. Then the given probabilities can be written as Bayes’ Theorem can be used to compute the probability of a sporting event () under the condition that the parking lot is full (): Based on the information that the garage is full, there is a 56% probability that a sporting event is being held on campus that evening.
Guided Practice 3.45
Use the information in the previous exercise and example to verify the probability that there is an academic event conditioned on the parking lot being full is 0.35.14
Guided Practice 3.46
In Guided Practice 3.43 and 3.45, you found that if the parking lot is full, the probability there is a sporting event is 0.56 and the probability there is an academic event is 0.35. Using this information, compute no event the lot is full.15
The last several exercises offered a way to update our belief about whether there is a sporting event, academic event, or no event going on at the school based on the information that the parking lot was full. This strategy of updating beliefs using Bayes’ Theorem is actually the foundation of an entire section of statistics called Bayesian statistics. While Bayesian statistics is very important and useful, we will not have time to cover much more of it in this book.
Exercises
Exercise 3.13
Joint and conditional probabilities. P(A) = 0.3, P(B) = 0.7
Can you compute P(A and B) if you only know P(A) and P(B)?
Assuming that events A and B arise from independent random processes,
what is P(A and B)?
what is P(A or B)?
what is P(AB)?
If we are given that P(A and B) = 0.1, are the random variables giving rise to events A and B independent?
If we are given that P(A and B) = 0.1, what is P(AB)?
Exercise 3.14
PB & J. Suppose 80% of people like peanut butter, 89% like jelly, and 78% like both. Given that a randomly sampled person likes peanut butter, what’s the probability that he also likes jelly?
Exercise 3.15
Global warming. A Pew Research poll asked 1,306 Americans “From what you’ve read and heard, is there solid evidence that the average temperature on earth has been getting warmer over the past few decades, or not?". The table below shows the distribution of responses by party and ideology, where the counts have been replaced with relative frequencies. 16
| Response | |||||
| Earth is | Not | Don’t Know | |||
| warming | warming | Refuse | Total | ||
| Conservative Republican | 0.11 | 0.20 | 0.02 | 0.33 | |
| Party and | Mod/Lib Republican | 0.06 | 0.06 | 0.01 | 0.13 |
| Ideology | Mod/Cons Democrat | 0.25 | 0.07 | 0.02 | 0.34 |
| Liberal Democrat | 0.18 | 0.01 | 0.01 | 0.20 | |
| Total | 0.60 | 0.34 | 0.06 | 1.00 | |
Are believing that the earth is warming and being a liberal Democrat mutually exclusive?
What is the probability that a randomly chosen respondent believes the earth is warming or is a liberal Democrat?
What is the probability that a randomly chosen respondent believes the earth is warming given that he is a liberal Democrat?
What is the probability that a randomly chosen respondent believes the earth is warming given that he is a conservative Republican?
Does it appear that whether or not a respondent believes the earth is warming is independent of their party and ideology? Explain your reasoning.
What is the probability that a randomly chosen respondent is a moderate/liberal Republican given that he does not believe that the earth is warming?
Exercise 3.16
Health coverage, relative frequencies. The Behavioral Risk Factor Surveillance System (BRFSS) is an annual telephone survey designed to identify risk factors in the adult population and report emerging health trends. The following table displays the distribution of health status of respondents to this survey (excellent, very good, good, fair, poor) and whether or not they have health insurance.
| Health Status | |||||||
| Excellent | Very good | Good | Fair | Poor | Total | ||
| Health | No | 0.0230 | 0.0364 | 0.0427 | 0.0192 | 0.0050 | 0.1262 |
| Coverage | Yes | 0.2099 | 0.3123 | 0.2410 | 0.0817 | 0.0289 | 0.8738 |
| Total | 0.2329 | 0.3486 | 0.2838 | 0.1009 | 0.0338 | 1.0000 | |
Are being in excellent health and having health coverage mutually exclusive?
What is the probability that a randomly chosen individual has excellent health?
What is the probability that a randomly chosen individual has excellent health given that he has health coverage?
What is the probability that a randomly chosen individual has excellent health given that he doesn’t have health coverage?
Do having excellent health and having health coverage appear to be independent?
Exercise 3.17
Burger preferences. A 2010 SurveyUSA poll asked 500 Los Angeles residents, “What is the best hamburger place in Southern California? Five Guys Burgers? In-N-Out Burger? Fat Burger? Tommy’s Hamburgers? Umami Burger? Or somewhere else?” The distribution of responses by gender is shown below. 17
| Gender | ||||
| Male | Female | Total | ||
| Five Guys Burgers | 5 | 6 | 11 | |
| In-N-Out Burger | 162 | 181 | 343 | |
| Best | Fat Burger | 10 | 12 | 22 |
| hamburger | Tommy’s Hamburgers | 27 | 27 | 54 |
| place | Umami Burger | 5 | 1 | 6 |
| Other | 26 | 20 | 46 | |
| Not Sure | 13 | 5 | 18 | |
| Total | 248 | 252 | 500 | |
Are being female and liking Five Guys Burgers mutually exclusive?
What is the probability that a randomly chosen male likes In-N-Out the best?
What is the probability that a randomly chosen female likes In-N-Out the best?
What is the probability that a man and a woman who are dating both like In-N-Out the best? Note any assumption you make and evaluate whether you think that assumption is reasonable.
What is the probability that a randomly chosen person likes Umami best or that person is female?
Exercise 3.18
Assortative mating. Assortative mating is a nonrandom mating pattern where individuals with similar genotypes and/or phenotypes mate with one another more frequently than what would be expected under a random mating pattern. Researchers studying this topic collected data on eye colors of 204 Scandinavian men and their female partners. The table below summarizes the results.18
| Partner (female) | |||||
| Blue | Brown | Green | Total | ||
| Blue | 78 | 23 | 13 | 114 | |
| Self (male) | Brown | 19 | 23 | 12 | 54 |
| Green | 11 | 9 | 16 | 36 | |
| Total | 108 | 55 | 41 | 204 | |
What is the probability that a randomly chosen male respondent or his partner has blue eyes?
What is the probability that a randomly chosen male respondent with blue eyes has a partner with blue eyes?
What is the probability that a randomly chosen male respondent with brown eyes has a partner with blue eyes? What about the probability of a randomly chosen male respondent with green eyes having a partner with blue eyes?
Does it appear that the eye colors of male respondents and their partners are independent? Explain your reasoning.
Exercise 3.19
Drawing box plots. After an introductory statistics course, 80% of students can successfully construct box plots. Of those who can construct box plots, 86% passed, while only 65% of those students who could not construct box plots passed.
Construct a tree diagram of this scenario.
Calculate the probability that a student is able to construct a box plot if it is known that he passed.
Exercise 3.20
Predisposition for thrombosis. A genetic test is used to determine if people have a predisposition for thrombosis, which is the formation of a blood clot inside a blood vessel that obstructs the flow of blood through the circulatory system. It is believed that 3% of people actually have this predisposition. The genetic test is 99% accurate if a person actually has the predisposition, meaning that the probability of a positive test result when a person actually has the predisposition is 0.99. The test is 98% accurate if a person does not have the predisposition. What is the probability that a randomly selected person who tests positive for the predisposition by the test actually has the predisposition?
Exercise 3.21
It’s never lupus. Lupus is a medical phenomenon where antibodies that are supposed to attack foreign cells to prevent infections instead see plasma proteins as foreign bodies, leading to a high risk of blood clotting. It is believed that 2% of the population suffer from this disease. The test is 98% accurate if a person actually has the disease. The test is 74% accurate if a person does not have the disease. There is a line from the Fox television show House that is often used after a patient tests positive for lupus: “It’s never lupus." Do you think there is truth to this statement? Use appropriate probabilities to support your answer.
Exercise 3.22
Exit poll. Edison Research gathered exit poll results from several sources for the Wisconsin recall election of Scott Walker. They found that 53% of the respondents voted in favor of Scott Walker. Additionally, they estimated that of those who did vote in favor for Scott Walker, 37% had a college degree, while 44% of those who voted against Scott Walker had a college degree. Suppose we randomly sampled a person who participated in the exit poll and found that he had a college degree. What is the probability that he voted in favor of Scott Walker? 19
Notes
Each of the four outcome combination are disjoint, all probabilities are indeed non-negative, and the sum of the probabilities is . ↩
(a) If the photo is about fashion and the ML algorithm prediction was correct, then the ML algorithm my have a value of
pred_fashion: (b) The equation for conditional probability indicates we should first find
and .
Then the ratio represents the conditional probability: . ↩(a) This probability is . (b) The total equals 1. (c) Under the condition the photo is about fashion, the ML algorithm must have either predicted it was about fashion or predicted it was not about fashion. The complement still works for conditional probabilities, provided the probabilities are conditioned on the same information. ↩
result=diedinoculated=no. ↩result=diedinoculated=yes(if we avoided rounding errors, we’d get ). The death rate for individuals who were inoculated is only about 1 in 40 while the death rate is about 1 in 7 for those who were not inoculated. ↩Brief answers: (a) Observational. (b) No, we cannot infer causation from this observational study. (c) Accessibility to the latest and best medical care. There are other valid answers for part (c). ↩
The answer is 0.0382, which can be verified using Figure 3.16. ↩
There were only two possible outcomes:
livedordied. This means that 100% - 97.54% = 2.46% of the people who were inoculated died. ↩The samples are large relative to the difference in death rates for the “inoculated” and “not inoculated” groups, so it seems there is an association between
inoculatedandoutcome. However, as noted in the solution to Guided Practice 3.33, this is an observational study and we cannot be sure if there is a causal connection. (Further research has shown that inoculation is effective at reducing death rates.) ↩Brief solutions: (a) . (b) . (c) . (d) The probability is the same as in part (c): . The probability that was unchanged by knowledge about , which makes sense as and are independent. ↩
He has forgotten that the next roulette spin is independent of the previous spins. Casinos do employ this practice, posting the last several outcomes of many betting games to trick unsuspecting gamblers into believing the odds are in their favor. This is called the gambler’s fallacy. ↩
(a) The tree diagram is shown to the right.
(b) Identify which two joint probabilities represent students who passed, and add them: passed.
(c) construct tree diagram passed.
↩The tree diagram, with three primary branches, is shown to the right. Next, we identify two probabilities from the tree diagram. (1) The probability that there is a sporting event and the garage is full: 0.14. (2) The probability the garage is full: . Then the solution is the ratio of these probabilities: . If the garage is full, there is a 56% probability that there is a sporting event.
Short answer: ↩
Each probability is conditioned on the same information that the garage is full, so the complement may be used: . ↩
Pew Research Center, Majority of Republicans No Longer See Evidence of Global Warming, data collected on October 27, 2010. ↩
SurveyUSA, Results of SurveyUSA News Poll #17718, data collected on December 2, 2010. ↩
Laeng, B. et al. Why do blue-eyed men prefer women with the same eye color?. Behavioral Ecology and Sociobiology. 2007. ↩
New York Times, Wisconsin recall exit polls. ↩