Probability forms the foundation of statistics, and you’re probably already aware of many of the ideas presented in this chapter. However, formalization of probability concepts is likely new for most readers.
this chapter provides a theoretical foundation for the ideas in later chapters and provides a path to a deeper understanding, mastery of the concepts introduced in this chapter is not required for applying the methods introduced in the rest of this book.
Statistics is based on probability, and while probability is not required for the applied techniques in this book, it may help you gain a deeper understanding of the methods and set a better foundation for future courses.
Introductory examples
Before we get into technical ideas, let’s walk through some basic examples that may feel more familiar.
Example 3.1
A “die”, the singular of dice, is a cube with six faces numbered 1, 2, 3, 4, 5, and 6. What is the chance of getting 1 when rolling a die?
If the die is fair, then the chance of a 1 is as good as the chance of any other number. Since there are six outcomes, the chance must be 1-in-6 or, equivalently, .
Example 3.2
What is the chance of getting a 1 or 2 in the next roll?
1 and 2 constitute two of the six equally likely possible outcomes, so the chance of getting one of these two outcomes must be .
Example 3.3
What is the chance of getting either 1, 2, 3, 4, 5, or 6 on the next roll?
100%. The outcome must be one of these numbers.
Example 3.4
What is the chance of not rolling a 2?
Since the chance of rolling a 2 is or , the chance of not rolling a 2 must be or .
Alternatively, we could have noticed that not rolling a 2 is the same as getting a 1, 3, 4, 5, or 6, which makes up five of the six equally likely outcomes and has probability .
Example 3.5
Consider rolling two dice. If of the time the first die is a 1 and of those times the second die is a 1, what is the chance of getting two 1s?
If % of the time the first die is a 1 and of those times the second die is also a 1, then the chance that both dice are 1 is or .
Probability
We use probability to build tools to describe and understand apparent randomness. We often frame probability in terms of a random process giving rise to an outcome.
| Roll a die | 1, 2, 3, 4, 5, or 6 |
|
| Flip a coin | H or T |
Rolling a die or flipping a coin is a seemingly random process and each gives rise to an outcome.
Probability
The probability of an outcome is the proportion of times the outcome would occur if we observed the random process an infinite number of times.
Probability is defined as a proportion, and it always takes values between 0 and 1 (inclusively). It may also be displayed as a percentage between 0% and 100%.
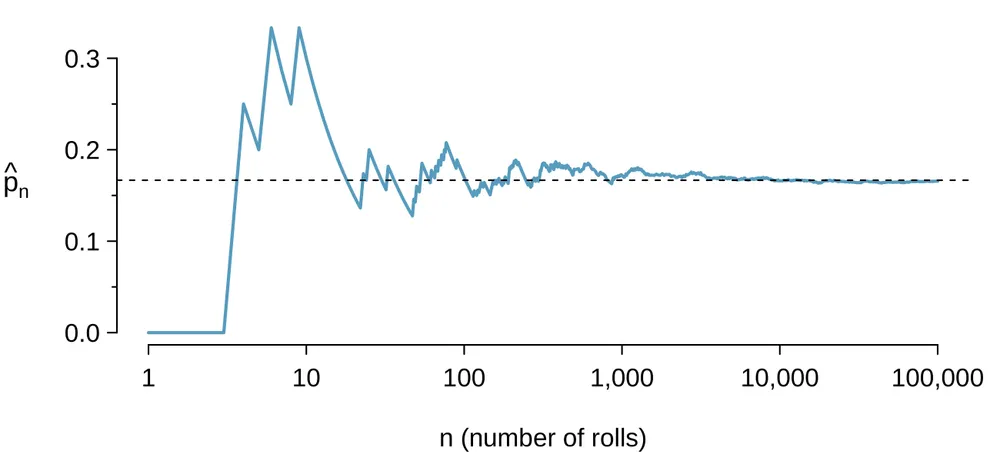
Probability can be illustrated by rolling a die many times. Let be the proportion of outcomes that are 1 after the first rolls. As the number of rolls increases, will converge to the probability of rolling a 1, . Figure 3.1 shows this convergence for 100,000 die rolls. The tendency of to stabilize around is described by the Law of Large Numbers.
Law of Large Numbers
As more observations are collected, the proportion of occurrences with a particular outcome converges to the probability of that outcome.
Occasionally the proportion will veer off from the probability and appear to defy the Law of Large Numbers, as does many times in Figure 3.1. However, these deviations become smaller as the number of rolls increases.
Above we write as the probability of rolling a 1. We can also write this probability as As we become more comfortable with this notation, we will abbreviate it further. For instance, if it is clear that the process is “rolling a die”, we could abbreviate rolling a 1 as 1.
Guided Practice 3.6
Random processes include rolling a die and flipping a coin. (a) Think of another random process. (b) Describe all the possible outcomes of that process. For instance, rolling a die is a random process with possible outcomes 1, 2, ..., 6.1
What we think of as random processes are not necessarily random, but they may just be too difficult to understand exactly. The fourth example in the footnote solution to Guided Practice 3.6 suggests a roommate’s behavior is a random process. However, even if a roommate’s behavior is not truly random, modeling her behavior as a random process can still be useful.
Disjoint or mutually exclusive outcomes
Two outcomes are called disjoint or mutually exclusive if they cannot both happen. For instance, if we roll a die, the outcomes 1 and 2 are disjoint since they cannot both occur. On the other hand, the outcomes 1 and “rolling an odd number” are not disjoint since both occur if the outcome of the roll is a 1. The terms disjoint and mutually exclusive are equivalent and interchangeable.
Calculating the probability of disjoint outcomes is easy. When rolling a die, the outcomes 1 and 2 are disjoint, and we compute the probability that one of these outcomes will occur by adding their separate probabilities: What about the probability of rolling a 1, 2, 3, 4, 5, or 6? Here again, all of the outcomes are disjoint so we add the probabilities: The Addition Rule guarantees the accuracy of this approach when the outcomes are disjoint.
Addition Rule of disjoint outcomes
If and represent two disjoint outcomes, then the probability that one of them occurs is given by If there are many disjoint outcomes , ..., , then the probability that one of these outcomes will occur is
Guided Practice 3.7
We are interested in the probability of rolling a 1, 4, or 5. (a) Explain why the outcomes 1, 4, and 5 are disjoint. (b) Apply the Addition Rule for disjoint outcomes to determine 1 or 4 or 5.2
Guided Practice 3.8
In the loans data set in Chapter 2, the homeownership variable described whether the borrower rents, has a mortgage, or owns her property. Of the 10,000 borrowers, 3858 rented, 4789 had a mortgage, and 1353 owned their home.3
Are the outcomes
rent,mortgage, andowndisjoint?Determine the proportion of loans with value
mortgageandownseparately.Use the Addition Rule for disjoint outcomes to compute the probability a randomly selected loan from the data set is for someone who has a mortgage or owns her home.
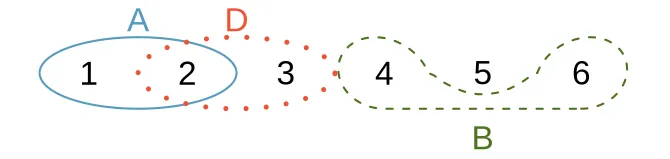
Data scientists rarely work with individual outcomes and instead consider sets or collections of outcomes. Let represent the event where a die roll results in 1 or 2 and represent the event that the die roll is a 4 or a 6. We write as the set of outcomes 1, 2 and 4, 6. These sets are commonly called events. Because and have no elements in common, they are disjoint events. and are represented in Figure 3.2.
The Addition Rule applies to both disjoint outcomes and disjoint events. The probability that one of the disjoint events or occurs is the sum of the separate probabilities:
Guided Practice 3.9
(a) Verify the probability of event , , is using the Addition Rule. (b) Do the same for event .4
Guided Practice 3.10
(a) Using Figure 3.2 as a reference, what outcomes are represented by event ? (b) Are events and disjoint? (c) Are events and disjoint?5
Guided Practice 3.11
In Guided Practice 3.10, you confirmed and from Figure 3.2 are disjoint. Compute the probability that event or event occurs.6
Probabilities when events are not disjoint
Let’s consider calculations for two events that are not disjoint in the context of a regular deck of 52 cards, represented in Figure 3.3. If you are unfamiliar with the cards in a regular deck, please see the footnote.7
2 |
3 |
4 |
5 |
6 |
7 |
8 |
9 |
10 |
J |
Q |
K |
A |
2 |
3 |
4 |
5 |
6 |
7 |
8 |
9 |
10 |
J |
Q |
K |
A |
2 |
3 |
4 |
5 |
6 |
7 |
8 |
9 |
10 |
J |
Q |
K |
A |
2 |
3 |
4 |
5 |
6 |
7 |
8 |
9 |
10 |
J |
Q |
K |
A |
Guided Practice 3.12
(a) What is the probability that a randomly selected card is a diamond? (b) What is the probability that a randomly selected card is a face card?8
Venn diagrams are useful when outcomes can be categorized as “in” or “out” for two or three variables, attributes, or random processes. The Venn diagram in Figure 3.4 uses a circle to represent diamonds and another to represent face cards. If a card is both a diamond and a face card, it falls into the intersection of the circles. If it is a diamond but not a face card, it will be in part of the left circle that is not in the right circle (and so on). The total number of cards that are diamonds is given by the total number of cards in the diamonds circle: . The probabilities are also shown (e.g. ).
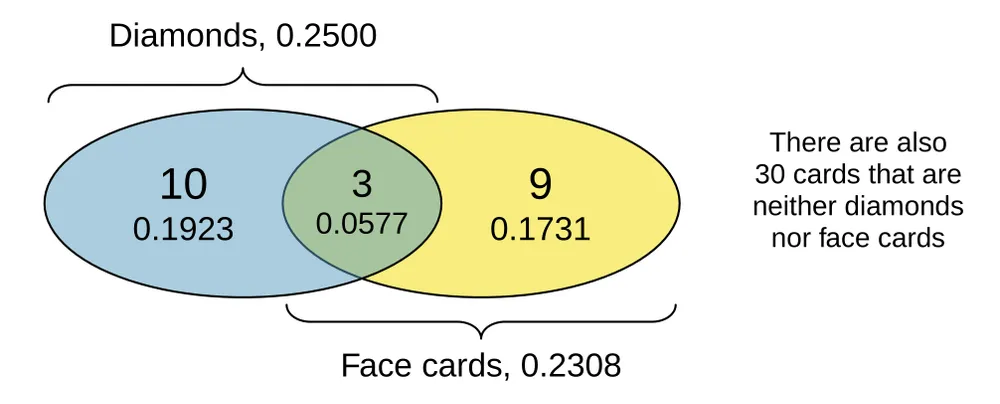
Let represent the event that a randomly selected card is a diamond and represent the event that it is a face card. How do we compute or ? Events and are not disjoint – the cards , , and fall into both categories – so we cannot use the Addition Rule for disjoint events. Instead we use the Venn diagram. We start by adding the probabilities of the two events:
, the three cards that are in both events were counted twice, once in each probability. We must correct this double counting: This equation is an example of the General Addition Rule.
General Addition Rule
If and are any two events, disjoint or not, then the probability that at least one of them will occur is where and is the probability that both events occur.
Tip: “or” is inclusive
When we write “or” in statistics, we mean “and/or” unless we explicitly state otherwise. Thus, or occurs means , , or both and occur.
Guided Practice 3.13
(a) If and are disjoint, describe why this implies and . (b) Using part (a), verify that the General Addition Rule simplifies to the simpler Addition Rule for disjoint events if and are disjoint.9
Guided Practice 3.14
In the loans data set describing 10,000 loans, 1495 loans were from joint applications (e.g. a couple applied together), 4789 applicants had a mortgage, and 950 had both of these characteristics. Create a Venn diagram for this setup.10
Guided Practice 3.15
(a) Use your Venn diagram from Guided Practice 3.14 to determine the probability a randomly drawn loan from the loans data set is from a joint application where the couple had a mortgage. (b) What is the probability that the loan had either of these attributes?11
Probability distributions
A probability distribution is a table of all disjoint outcomes and their associated probabilities. Figure 3.5 shows the probability distribution for the sum of two dice.
| Dice sum | 2 | 3 | 4 | 5 | 6 | 7 | 8 | 9 | 10 | 11 | 12 |
| Probability |
Rules for probability distributions
A probability distribution is a list of the possible outcomes with corresponding probabilities that satisfies three rules:
The outcomes listed must be disjoint.
Each probability must be between 0 and 1.
The probabilities must total 1.
Guided Practice 3.16
Figure 3.6 suggests three distributions for household income in the United States. Only one is correct. Which one must it be? What is wrong with the other two?12
| Income Range | $0-25k | $25k-50k | $50k-100k | $100k+ |
|---|---|---|---|---|
| (a) | 0.18 | 0.39 | 0.33 | 0.16 |
| (b) | 0.38 | -0.27 | 0.52 | 0.37 |
| (c) | 0.28 | 0.27 | 0.29 | 0.16 |
Chapter 1 emphasized the importance of plotting data to provide quick summaries. Probability distributions can also be summarized in a bar plot. For instance, the distribution of US household incomes is shown in Figure 3.7 as a bar plot. The probability distribution for the sum of two dice is shown in Figure 3.5 and plotted in Figure 3.8.
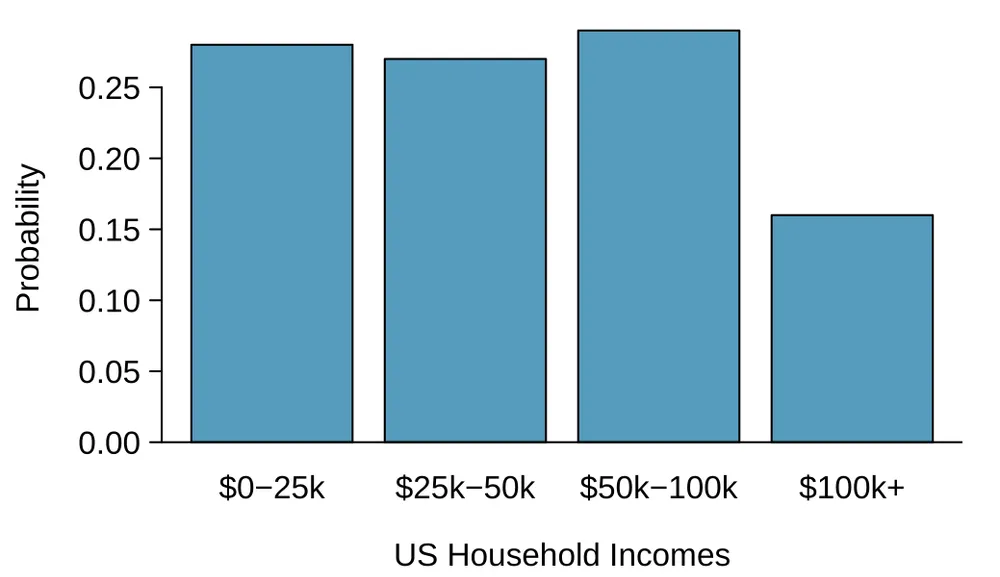
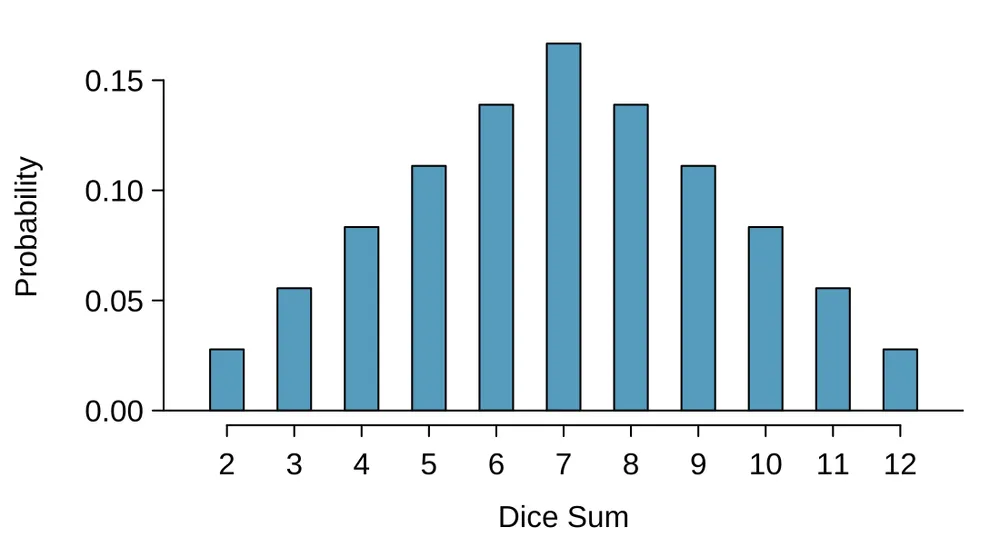
In these bar plots, the bar heights represent the probabilities of outcomes. If the outcomes are numerical and discrete, it is usually (visually) convenient to make a bar plot that resembles a histogram, as in the case of the sum of two dice. Another example of plotting the bars at their respective locations is shown in Figure 3.18 in Section 3.4.
Complement of an event
Rolling a die produces a value in the set 1, 2, 3, 4, 5, 6. This set of all possible outcomes is called the sample space () for rolling a die. We often use the sample space to examine the scenario where an event does not occur.
Let 2, 3 represent the event that the outcome of a die roll is 2 or 3. Then the complement of represents all outcomes in our sample space that are not in , which is denoted by 1, 4, 5, 6. That is, is the set of all possible outcomes not already included in . Figure 3.9 shows the relationship between , , and the sample space .
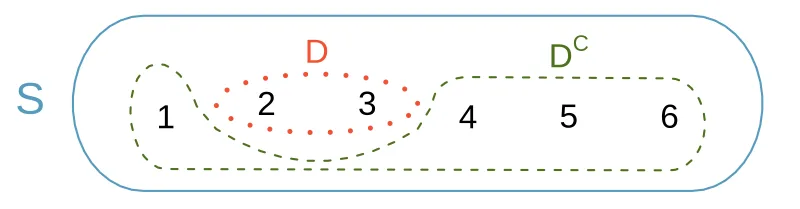
2, 3 and its complement, 1, 4, 5, 6. represents the sample space, which is the set of all possible outcomes.Guided Practice 3.17
(a) Compute rolling a 1, 4, 5, or 6. (b) What is ?13
Guided Practice 3.18
Events 1, 2 and 4, 6 are shown in Figure 3.2 in Section 3.1. (a) Write out what and represent. (b) Compute and . (c) Compute and .14
A complement of an event is constructed to have two very important properties: (i) every possible outcome not in is in , and (ii) and are disjoint. Property (i) implies That is, if the outcome is not in , it must be represented in . We use the Addition Rule for disjoint events to apply Property (ii): Combining the last two equations yields a very useful relationship between the probability of an event and its complement.
Complement
The complement of event is denoted , and represents all outcomes not in . and are mathematically related:
In simple examples, computing or is feasible in a few steps. However, using the complement can save a lot of time as problems grow in complexity.
Guided Practice 3.19
Let represent the event where we roll two dice and their total is less than 12. (a) What does the event represent? (b) Determine from Figure 3.5 in Section 3.1. (c) Determine .15
Guided Practice 3.20
Find the following probabilities for rolling two dice:16
The sum of the dice is not
6.The sum is at least
4. That is, determine the probability of the event4,5, ...,12.The sum is no more than
10. That is, determine the probability of the event2,3, ...,10.
Independence
Just as variables and observations can be independent, random processes can be independent, too. Two processes are independent if knowing the outcome of one provides no useful information about the outcome of the other. For instance, flipping a coin and rolling a die are two independent processes – knowing the coin was heads does not help determine the outcome of a die roll. On the other hand, stock prices usually move up or down together, so they are not independent.
Example 3.5 provides a basic example of two independent processes: rolling two dice. We want to determine the probability that both will be 1. Suppose one of the dice is red and the other white. If the outcome of the red die is a 1, it provides no information about the outcome of the white die. We first encountered this same question in Example 3.5 (Section 3.1), where we calculated the probability using the following reasoning: of the time the red die is a 1, and of those times the white die will also be 1. This is illustrated in Figure 3.10. Because the rolls are independent, the probabilities of the corresponding outcomes can be multiplied to get the final answer: . This can be generalized to many independent processes.
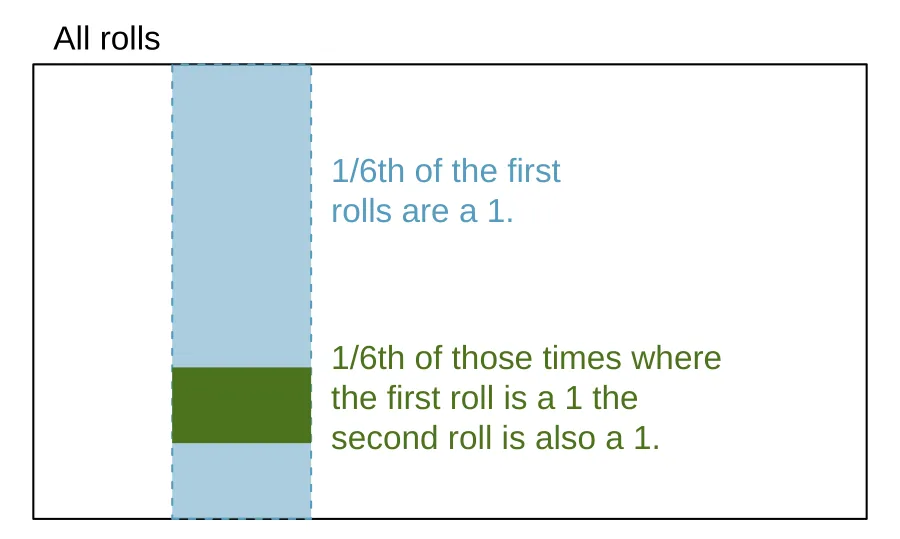
1. Then of those times, the second roll will also be a 1.Example 3.21
What if there was also a blue die independent of the other two? What is the probability of rolling the three dice and getting all 1s?
The same logic applies from Example 3.5. If of the time the white and red dice are both 1, then of those times the blue die will also be 1, so multiply:
Example 3.21 illustrates what is called the Multiplication Rule for independent processes.
Multiplication Rule for independent processes
If and represent events from two different and independent processes, then the probability that both and occur can be calculated as the product of their separate probabilities: Similarly, if there are events , ..., from independent processes, then the probability they all occur is
Guided Practice 3.22
About 9% of people are left-handed. Suppose 2 people are selected at random from the U.S. population. Because the sample size of 2 is very small relative to the population, it is reasonable to assume these two people are independent. (a) What is the probability that both are left-handed? (b) What is the probability that both are right-handed?17
Guided Practice 3.23
Suppose 5 people are selected at random.18
What is the probability that all are right-handed?
What is the probability that all are left-handed?
What is the probability that not all of the people are right-handed?
Suppose the variables handedness and sex are independent, i.e. knowing someone’s sex provides no useful information about their handedness and vice-versa. Then we can compute whether a randomly selected person is right-handed and female19 using the Multiplication Rule:
Guided Practice 3.24
Three people are selected at random.20
What is the probability that the first person is male and right-handed?
What is the probability that the first two people are male and right-handed?.
What is the probability that the third person is female and left-handed?
What is the probability that the first two people are male and right-handed and the third person is female and left-handed?
Sometimes we wonder if one outcome provides useful information about another outcome. The question we are asking is, are the occurrences of the two events independent? We say that two events and are independent if they satisfy .
Example 3.25
If we shuffle up a deck of cards and draw one, is the event that the card is a heart independent of the event that the card is an ace?
The probability the card is a heart is and the probability that it is an ace is . The probability the card is the ace of hearts is . We check whether is satisfied: Because the equation holds, the event that the card is a heart and the event that the card is an ace are independent events.
Exercises
Exercise 3.1
True or false. Determine if the statements below are true or false, and explain your reasoning.
If a fair coin is tossed many times and the last eight tosses are all heads, then the chance that the next toss will be heads is somewhat less than 50%.
Drawing a face card (jack, queen, or king) and drawing a red card from a full deck of playing cards are mutually exclusive events.
Drawing a face card and drawing an ace from a full deck of playing cards are mutually exclusive events.
Exercise 3.2
Roulette wheel. The game of roulette involves spinning a wheel with 38 slots: 18 red, 18 black, and 2 green. A ball is spun onto the wheel and will eventually land in a slot, where each slot has an equal chance of capturing the ball.
You watch a roulette wheel spin 3 consecutive times and the ball lands on a red slot each time. What is the probability that the ball will land on a red slot on the next spin?
You watch a roulette wheel spin 300 consecutive times and the ball lands on a red slot each time. What is the probability that the ball will land on a red slot on the next spin?
Are you equally confident of your answers to parts (a) and (b)? Why or why not?
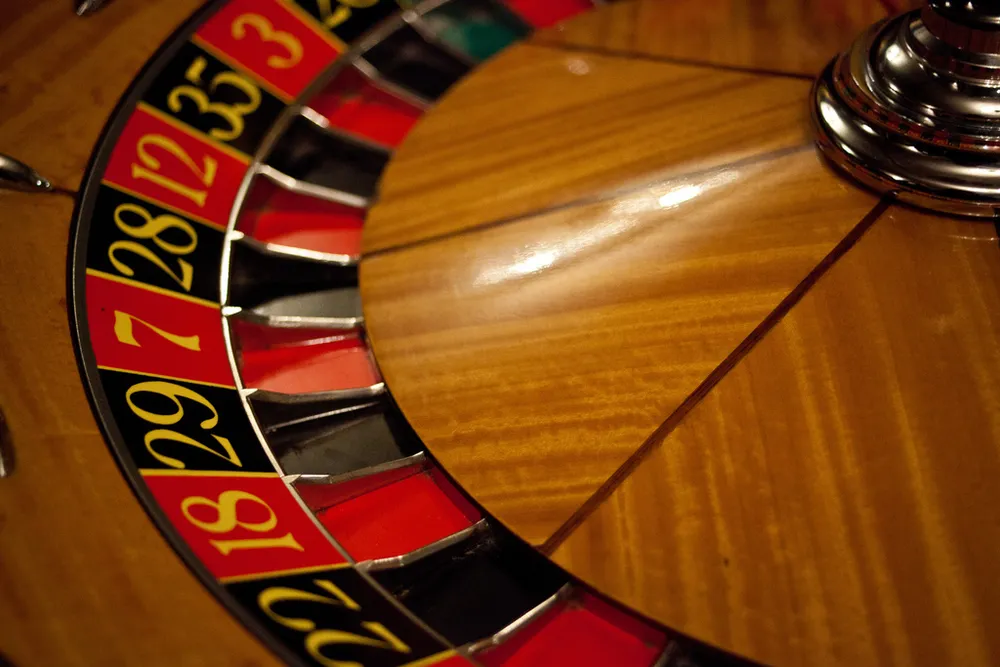
Photo by Håkan Dahlström
(http://flic.kr/p/93fEzp)
CC BY 2.0 license
Exercise 3.3
Four games, one winner. Below are four versions of the same game. Your archnemesis gets to pick the version of the game, and then you get to choose how many times to flip a coin: 10 times or 100 times. Identify how many coin flips you should choose for each version of the game. It costs $1 to play each game. Explain your reasoning.
If the proportion of heads is larger than 0.60, you win $1.
If the proportion of heads is larger than 0.40, you win $1.
If the proportion of heads is between 0.40 and 0.60, you win $1.
If the proportion of heads is smaller than 0.30, you win $1.
Exercise 3.4
Backgammon. Backgammon is a board game for two players in which the playing pieces are moved according to the roll of two dice. Players win by removing all of their pieces from the board, so it is usually good to roll high numbers. You are playing backgammon with a friend and you roll two 6s in your first roll and two 6s in your second roll. Your friend rolls two 3s in his first roll and again in his second row. Your friend claims that you are cheating, because rolling double 6s twice in a row is very unlikely. Using probability, show that your rolls were just as likely as his.
Exercise 3.5
Coin flips. If you flip a fair coin 10 times, what is the probability of
getting all tails?
getting all heads?
getting at least one tails?
Exercise 3.6
Dice rolls. If you roll a pair of fair dice, what is the probability of
getting a sum of 1?
getting a sum of 5?
getting a sum of 12?
Exercise 3.7
Swing voters. A Pew Research survey asked 2,373 randomly sampled registered voters their political affiliation (Republican, Democrat, or Independent) and whether or not they identify as swing voters. 35% of respondents identified as Independent, 23% identified as swing voters, and 11% identified as both.21
Are being Independent and being a swing voter disjoint, i.e. mutually exclusive?
Draw a Venn diagram summarizing the variables and their associated probabilities.
What percent of voters are Independent but not swing voters?
What percent of voters are Independent or swing voters?
What percent of voters are neither Independent nor swing voters?
Is the event that someone is a swing voter independent of the event that someone is a political Independent?
Exercise 3.8
Poverty and language. The American Community Survey is an ongoing survey that provides data every year to give communities the current information they need to plan investments and services. The 2010 American Community Survey estimates that 14.6% of Americans live below the poverty line, 20.7% speak a language other than English (foreign language) at home, and 4.2% fall into both categories. 22
Are living below the poverty line and speaking a foreign language at home disjoint?
Draw a Venn diagram summarizing the variables and their associated probabilities.
What percent of Americans live below the poverty line and only speak English at home?
What percent of Americans live below the poverty line or speak a foreign language at home?
What percent of Americans live above the poverty line and only speak English at home?
Is the event that someone lives below the poverty line independent of the event that the person speaks a foreign language at home?
Exercise 3.9
Disjoint vs. independent. In parts (a) and (b), identify whether the events are disjoint, independent, or neither (events cannot be both disjoint and independent).
You and a randomly selected student from your class both earn A’s in this course.
You and your class study partner both earn A’s in this course.
If two events can occur at the same time, must they be dependent?
Exercise 3.10
Guessing on an exam. In a multiple choice exam, there are 5 questions and 4 choices for each question (a, b, c, d). Nancy has not studied for the exam at all and decides to randomly guess the answers. What is the probability that:
the first question she gets right is the question?
she gets all of the questions right?
she gets at least one question right?
Exercise 3.11
Educational attainment of couples. The table below shows the distribution of education level attained by US residents by gender based on data collected in the 2010 American Community Survey. 23
l p7cm c c & &
& & Male & Female
& Less than 9th grade & 0.07 & 0.13
& 9th to 12th grade, no diploma & 0.10 & 0.09
Highest & HS graduate (or equivalent) & 0.30 & 0.20
education & Some college, no degree & 0.22 & 0.24
attained & Associate’s degree & 0.06 & 0.08
& Bachelor’s degree & 0.16 & 0.17
& Graduate or professional degree & 0.09 & 0.09
& Total & 1.00 & 1.00
What is the probability that a randomly chosen man has at least a Bachelor’s degree?
What is the probability that a randomly chosen woman has at least a Bachelor’s degree?
What is the probability that a man and a woman getting married both have at least a Bachelor’s degree? Note any assumptions you must make to answer this question.
If you made an assumption in part (c), do you think it was reasonable? If you didn’t make an assumption, double check your earlier answer and then return to this part.
Exercise 3.12
School absences. Data collected at elementary schools in DeKalb County, GA suggest that each year roughly 25% of students miss exactly one day of school, 15% miss 2 days, and 28% miss 3 or more days due to sickness. 24
What is the probability that a student chosen at random doesn’t miss any days of school due to sickness this year?
What is the probability that a student chosen at random misses no more than one day?
What is the probability that a student chosen at random misses at least one day?
If a parent has two kids at a DeKalb County elementary school, what is the probability that neither kid will miss any school? Note any assumption you must make to answer this question.
If a parent has two kids at a DeKalb County elementary school, what is the probability that both kids will miss some school, i.e. at least one day? Note any assumption you make.
If you made an assumption in part (d) or (e), do you think it was reasonable? If you didn’t make any assumptions, double check your earlier answers.
Notes
Here are four examples. (i) Whether someone gets sick in the next month or not is an apparently random process with outcomes
sickandnot. (ii) We can generate a random process by randomly picking a person and measuring that person’s height. The outcome of this process will be a positive number. (iii) Whether the stock market goes up or down next week is a seemingly random process with possible outcomesup,down, andno_change. Alternatively, we could have used the percent change in the stock market as a numerical outcome. (iv) Whether your roommate cleans her dishes tonight probably seems like a random process with possible outcomescleans_dishesandleaves_dishes. ↩(a) The random process is a die roll, and at most one of these outcomes can come up. This means they are disjoint outcomes. (b)
1or4or5145↩(a) Yes. Each loan is categorized in only one level of
homeownership. (b) Mortgage: . Own: . (c)mortgageorownmortgageown. ↩(a)
1or212. (b) Similarly, . ↩(a) Outcomes
2and3. (b) Yes, events and are disjoint because they share no outcomes. (c) The events and share an outcome in common,2, and so are not disjoint. ↩Since and are disjoint events, use the Addition Rule: or . ↩
The 52 cards are split into four suits: (club), (diamond), (heart), (spade). Each suit has its 13 cards labeled:
2,3, ...,10,J(jack),Q(queen),K(king), andA(ace). Thus, each card is a unique combination of a suit and a label, e.g.4andJ. The 12 cards represented by the jacks, queens, and kings are calledface cards. The cards that are or are typically colored red while the other two suits are typically colored black. ↩(a) There are 52 cards and 13 diamonds. If the cards are thoroughly shuffled, each card has an equal chance of being drawn, so the probability that a randomly selected card is a diamond is . (b) Likewise, there are 12 face cards, so face card. ↩
(a) If and are disjoint, and can never occur simultaneously. (b) If and are disjoint, then the last term of in the General Addition Rule formula is 0 (see part (a)) and we are left with the Addition Rule for disjoint events. ↩
Both the counts and corresponding probabilities (e.g. ) are shown. Notice that the number of loans represented in the left circle corresponds to , and the number represented in the right circle is .
(a) The solution is represented by the intersection of the two circles: 0.095. (b) This is the sum of the three disjoint probabilities shown in the circles: (off by 0.001 due to a rounding error). ↩
The probabilities of (a) do not sum to 1. The second probability in (b) is negative. This leaves (c), which sure enough satisfies the requirements of a distribution. One of the three was said to be the actual distribution of US household incomes, so it must be (c). ↩
(a) The outcomes are disjoint and each has probability , so the total probability is . (b) We can also see that . Since and are disjoint, . ↩
Brief solutions: (a)
3,4,5,6and1,2,3,5. (b) Noting that each outcome is disjoint, add the individual outcome probabilities to get and . (c) and are disjoint, and the same is true of and . Therefore, and . ↩(a) The complement of : when the total is equal to
12. (b) . (c) Use the probability of the complement from part (b), , and the equation for the complement: less than1212. ↩(a) First find
6, then use the complement: not66.(b) First find the complement, which requires much less effort:
2or3. Then calculate .(c) As before, finding the complement is the clever way to determine . First find
11or12. Then calculate . ↩(a) The probability the first person is left-handed is , which is the same for the second person. We apply the Multiplication Rule for independent processes to determine the probability that both will be left-handed: .
(b) It is reasonable to assume the proportion of people who are ambidextrous (both right- and left-handed) is nearly 0, which results in right-handed. Using the same reasoning as in part (a), the probability that both will be right-handed is . ↩
(a) The abbreviations
RHandLHare used for right-handed and left-handed, respectively. Since each are independent, we apply the Multiplication Rule for independent processes:(b) Using the same reasoning as in (a),
(c) Use the complement, all five are
RH, to answer this question: ↩The actual proportion of the U.S. population that is
femaleis about 50%, and so we use 0.5 for the probability of sampling a woman. However, this probability does differ in other countries. ↩Brief answers are provided. (a) This can be written in probability notation as a randomly selected person is male and right-handed. (b) 0.207. (c) 0.045. (d) 0.0093. ↩
Pew Research Center, With Voters Focused on Economy, Obama Lead Narrows, data collected between April 4-15, 2012. ↩
U.S. Census Bureau, 2010 American Community Survey 1-Year Estimates, Characteristics of People by Language Spoken at Home. ↩
U.S. Census Bureau, 2010 American Community Survey 1-Year Estimates, Educational Attainment. ↩
Mizan, S.S. et al. Absence, Extended Absence, and Repeat Tardiness Related to Asthma Status among Elementary School Children. Journal of Asthma. 2011. ↩