’ll consider Ebay auctions of a video game called Mario Kart for the Nintendo Wii. The outcome variable of interest is the total price of an auction, which is the highest bid plus the shipping cost. We will try to determine how total price is related to each characteristic in an auction while simultaneously controlling for other variables. For instance, all other characteristics held constant, are longer auctions associated with higher or lower prices? And, on average, how much more do buyers tend to pay for additional Wii wheels (plastic steering wheels that attach to the Wii controller) in auctions? Multiple regression will help us answer these and other questions.
Data set and the full model
The mariokart data set includes results from 141 auctions. Four observations from this data set are shown in Figure 9.13, and descriptions for each variable are shown in Figure 9.14. Notice that the condition and stock photo variables are indicator variables, similar to bankruptcy in the loan data set.
| price | cond_new | stock_photo | duration | wheels | |
|---|---|---|---|---|---|
| 1 | 51.55 | 1 | 1 | 3 | 1 |
| 2 | 37.04 | 0 | 1 | 7 | 1 |
| 140 | 38.76 | 0 | 0 | 7 | 0 |
| 141 | 54.51 | 1 | 1 | 1 | 2 |
mariokart data set.| variable | description |
|---|---|
price |
Final auction price plus shipping costs, in US dollars. |
cond_new |
Indicator variable for if the game is new (1) or used (0). |
stock_photo |
Indicator variable for if the auction’s main photo is a stock photo. |
duration |
The length of the auction, in days, taking values from 1 to 10. |
wheels |
The number of Wii wheels included with the auction. A Wii wheel is an optional steering wheel accessory that holds the Wii controller. |
mariokart data set.Guided Practice 9.20
We fit a linear regression model with the game’s condition as a predictor of auction price. Results of this model are summarized below:
| Estimate | Std. Error | t value | Pr(t) | |
| (Intercept) | 42.8711 | 0.8140 | 52.67 | 0.0001 |
| cond_new | 10.8996 | 1.2583 | 8.66 | 0.0001 |
Write down the equation for the model, note whether the slope is statistically different from zero, and interpret the coefficient.1
Sometimes there are underlying structures or relationships between predictor variables. For instance, new games sold on Ebay tend to come with more Wii wheels, which may have led to higher prices for those auctions. We would like to fit a model that includes all potentially important variables simultaneously. This would help us evaluate the relationship between a predictor variable and the outcome while controlling for the potential influence of other variables.
We want to construct a model that accounts for not only the game condition, as in Guided Practice 9.20, but simultaneously accounts for three other variables: Figure 9.15 summarizes the full model. Using this output, we identify the point estimates of each coefficient.
| Estimate | Std. Error | t value | Pr(t) | |
| (Intercept) | 36.2110 | 1.5140 | 23.92 | 0.0001 |
| cond_new | 5.1306 | 1.0511 | 4.88 | 0.0001 |
| stock_photo | 1.0803 | 1.0568 | 1.02 | 0.3085 |
| duration | -0.0268 | 0.1904 | -0.14 | 0.8882 |
| wheels | 7.2852 | 0.5547 | 13.13 | 0.0001 |
price is the outcome and cond_new, stock_photo, duration, and wheels are the predictors.Guided Practice 9.21
Write out the model’s equation using the point estimates from Figure 9.15. How many predictors are there in this model?2
Guided Practice 9.22
What does , the coefficient of variable (Wii wheels), represent? What is the point estimate of ?3
Guided Practice 9.23
Compute the residual of the first observation in Figure 9.13 using the equation identified in Guided Practice 9.21.4
Example 9.24
We estimated a coefficient for cond_new in Section 9.20 of with a standard error of when using simple linear regression. Why might there be a difference between that estimate and the one in the multiple regression setting?
If we examined the data carefully, we would see that there is collinearity among some predictors. For instance, when we estimated the connection of the outcome price and predictor cond_new using simple linear regression, we were unable to control for other variables like the number of Wii wheels included in the auction. That model was biased by the confounding variable wheels. When we use both variables, this particular underlying and unintentional bias is reduced or eliminated (though bias from other confounding variables may still remain).
Model selection
’s revisit the model for the Mario Kart auction and complete model selection using backwards selection. Recall that the full model took the following form:
Example 9.25
Results corresponding to the full model for the mariokart data were shown in Figure 9.15. For this model, we consider what would happen if dropping each of the variables in the model:
| Exclude ... | cond_new |
stock_photo |
duration |
wheels |
For the full model, . How should we proceed under the backward elimination strategy?
The third model without duration has the highest of 0.7128, so we compare it to for the full model. Because eliminating duration leads to a model with a higher , we drop duration from the model.
Guided Practice 9.26
In Example 9.25, we eliminated the duration variable, which resulted in a model with . Let’s look at if we would eliminate another variable from the model using backwards elimination:
Exclude duration and ... |
cond_new |
stock_photo |
wheels |
Should we eliminate any additional variable, and if so, which variable should we eliminate?5
Guided Practice 9.27
After eliminating the auction’s duration from the model, we are left with the following reduced model: How much would you predict for the total price for the Mario Kart game if it was used, used a stock photo, and included two wheels and put up for auction during the time period that the Mario Kart data were collected?6
Guided Practice 9.28
Would you be surprised if the seller from Guided Practice 9.27 didn’t get the exact price predicted?7
Checking model conditions using graphs
’s take a closer look at the diagnostics for the Mario Kart model to check if the model we have identified is reasonable.
- Check for outliers.
-
A histogram of the residuals is shown in Figure 9.16. With a data set well over a hundred, we’re primarily looking for major outliers. While one minor outlier appears on the upper end, it is not a concern for this large of a data set.
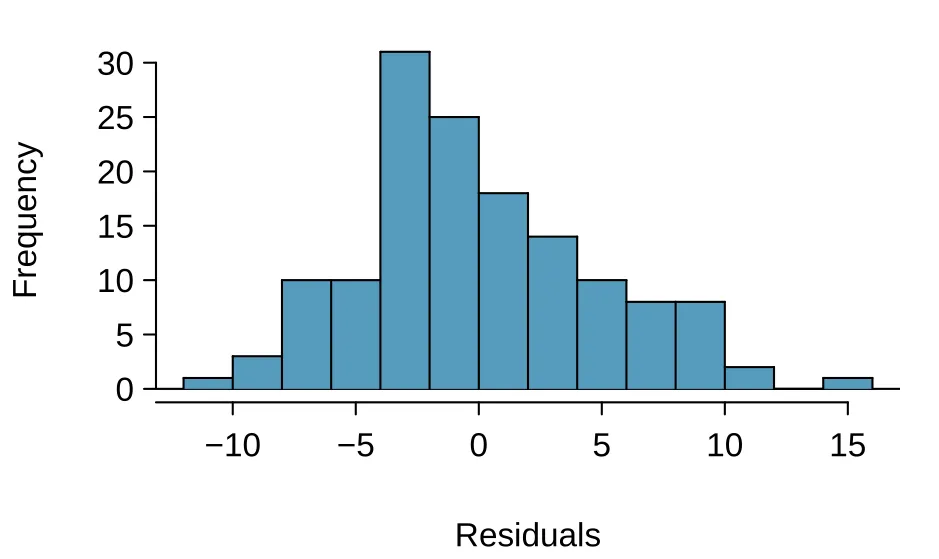
Figure 9.16. Histogram of the residuals. No clear outliers are evident. - Absolute values of residuals against fitted values.
-
A plot of the absolute value of the residuals against their corresponding fitted values () is shown in Figure 9.17. We don’t see any obvious deviations from constant variance in this example.
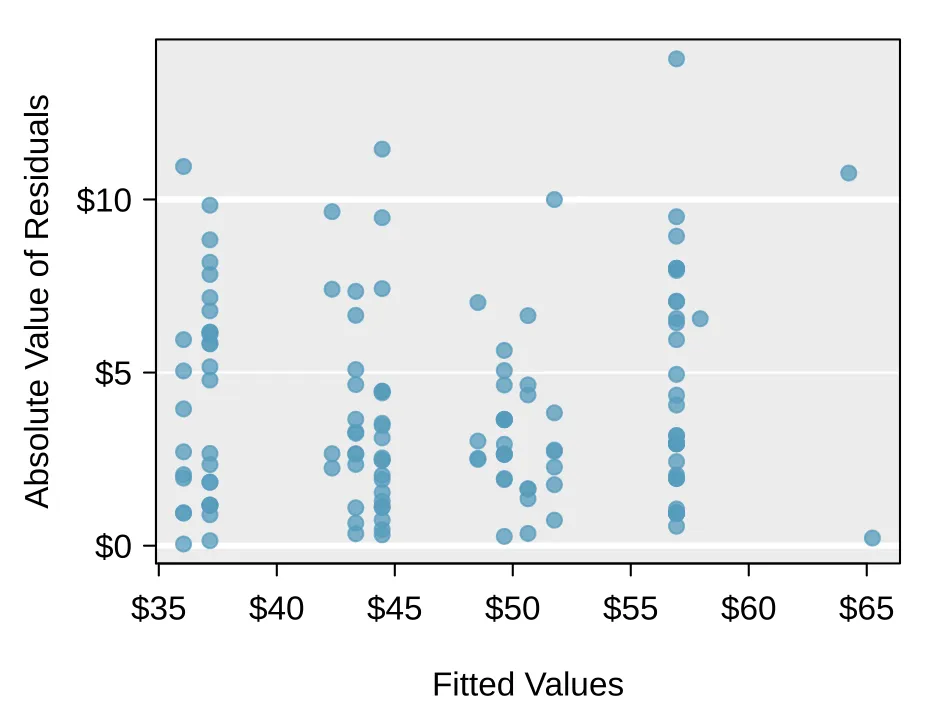
Figure 9.17. Absolute value of the residuals against the fitted values. No patterns are evident. - Residuals in order of their data collection.
-
A plot of the residuals in the order their corresponding auctions were observed is shown in Figure 9.18. Here we see no structure that indicates a problem.
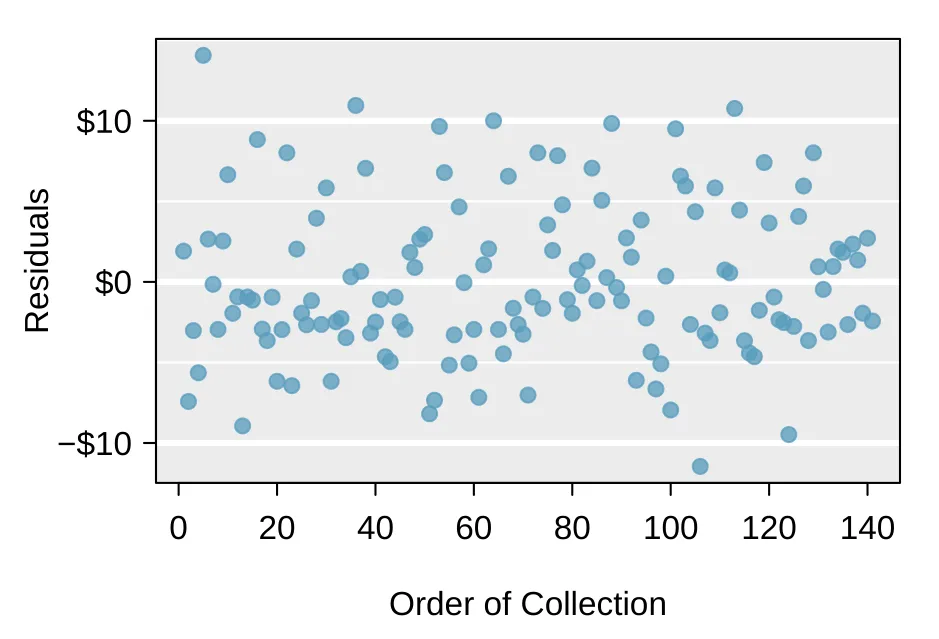
Figure 9.18. Residuals in the order that their corresponding observations were collected. There are no evident patterns. - Residuals against each predictor variable.
-
We consider a plot of the residuals against the
cond_newvariable, the residuals against thestock_photovariable, and the residuals against thewheelsvariable. These plots are shown in Figure 9.19. For the two-level condition variable, we are guaranteed not to see any remaining trend, and instead we are checking that the variability doesn’t fluctuate across groups, which it does not. However, looking at the stock photo variable, we find that there is some difference in the variability of the residuals in the two groups. Additionally, when we consider the residuals against thewheelsvariable, we see some possible structure. There appears to be curvature in the residuals, indicating the relationship is probably not linear.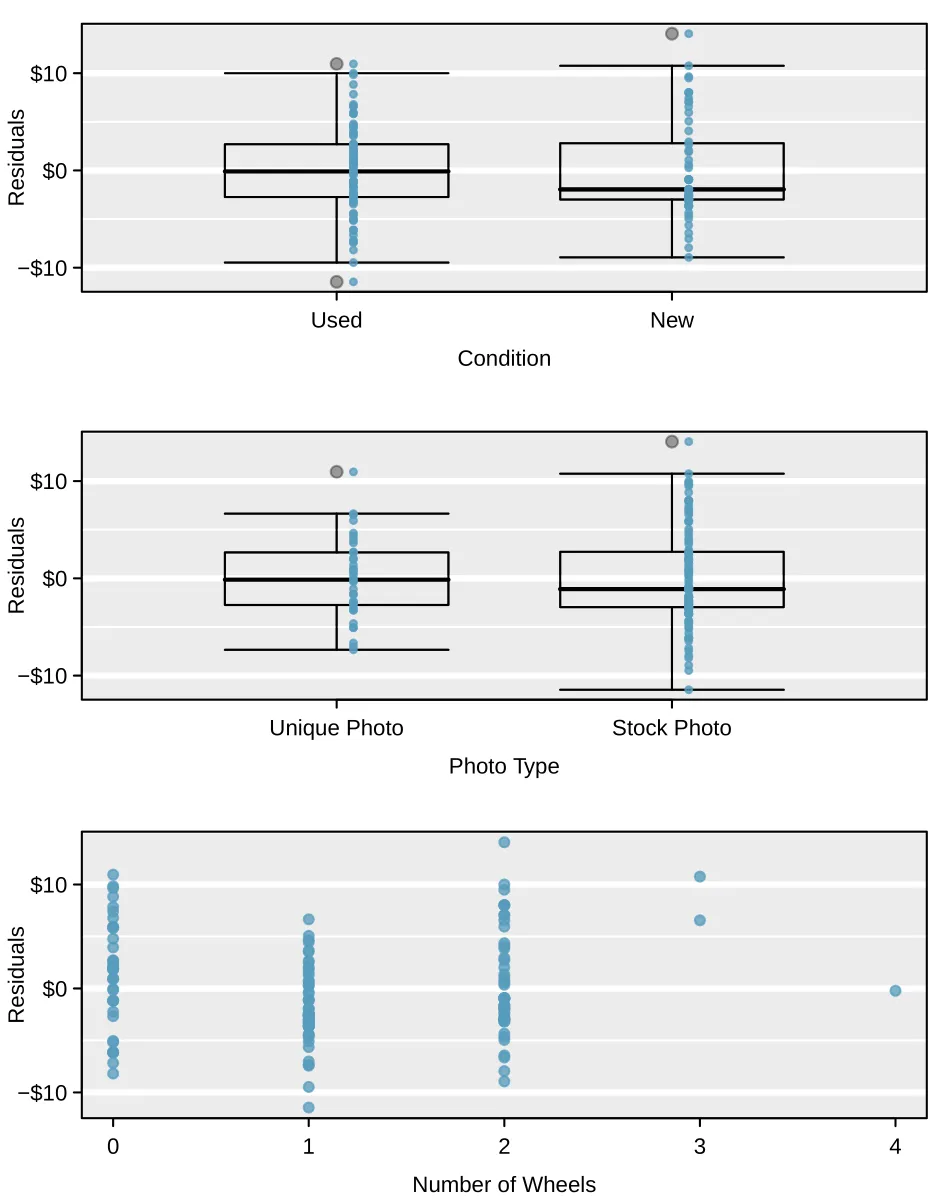
Figure 9.19. For the condition and stock photo variables, we check for differences in the distribution shape or variability of the residuals. In the case of the stock photos variable, we see a little less variability in the unique photo group than the stock photo group. For numerical predictors, we also check for trends or other structure. We see some slight bowing in the residuals against the wheelsvariable in the bottom plot.
As with the loans analysis, we would summarize diagnostics when reporting the model results. In the case of this auction data, we would report that there appears to be non-constant variance in the stock photo variable and that there may be a nonlinear relationship between the total price and the number of wheels included for an auction. This information would be important to buyers and sellers who may review the analysis, and omitting this information could be a setback to the very people who the model might assist.
Note: there are no exercises for this section.
Notes
The equation for the line may be written as Examining the regression output in Guided Practice 9.20, we can see that the p-value for
cond_newis very close to zero, indicating there is strong evidence that the coefficient is different from zero when using this simple one-variable model.The
cond_newis a two-level categorical variable that takes value 1 when the game is new and value 0 when the game is used. This means the 10.90 model coefficient predicts an extra $10.90 for those games that are new versus those that are used. ↩, with the predictors. ↩
It is the average difference in auction price for each additional Wii wheel included when holding the other variables constant. The point estimate is . ↩
, where 49.62 was computed using the variables values from the observation and the equation identified in Guided Practice 9.21. ↩
Removing any of the three remaining variables would lead to a decrease in , so we should not remove any additional variables from the model after we removed
duration. ↩We would plug in
0forcond_new1forstock_photo, and2forwheelsinto the equation, which would return $51.77, which is the total price we would expect for the auction. ↩No. The model provides the average auction price we would expect, and the price for one auction to the next will continue to vary a bit (but less than what our prediction would be without the model). ↩