this section we introduce logistic regression as a tool for building models when there is a categorical response variable with two levels, e.g. yes and no. Logistic regression is a type of generalized linear model (GLM) for response variables where regular multiple regression does not work very well. In particular, the response variable in these settings often takes a form where residuals look completely different from the normal distribution.
GLMs can be thought of as a two-stage modeling approach. We first model the response variable using a probability distribution, such as the binomial or Poisson distribution. Second, we model the parameter of the distribution using a collection of predictors and a special form of multiple regression. Ultimately, the application of a GLM will feel very similar to multiple regression, even if some of the details are different.
Resume data
We will consider experiment data from a study that sought to understand the effect of race and sex on job application callback rates; details of the study and a link to the data set may be found in Appendix B.9. To evaluate which factors were important, job postings were identified in Boston and Chicago for the study, and researchers created many fake resumes to send off to these jobs to see which would elicit a callback. The researchers enumerated important characteristics, such as years of experience and education details, and they used these characteristics to randomly generate the resumes. Finally, they randomly assigned a name to each resume, where the name would imply the applicant’s sex and race.
The first names that were used and randomly assigned in this experiment were selected so that they would predominantly be recognized as belonging to Black or White individuals; other races were not considered in this study. While no name would definitively be inferred as pertaining to a Black individual or to a White individual, the researchers conducted a survey to check for racial association of the names; names that did not pass this survey check were excluded from usage in the experiment. You can find the full set of names that did pass the survey test and were ultimately used in the study in Figure 9.20. For example, Lakisha was a name that their survey indicated would be interpreted as a Black woman, while Greg was a name that would generally be interpreted to be associated with a White male.
| first_name | race | sex | first_name | race | sex | first_name | race | sex | ||
| Aisha | black | female | Hakim | black | male | Laurie | white | female | ||
| Allison | white | female | Jamal | black | male | Leroy | black | male | ||
| Anne | white | female | Jay | white | male | Matthew | white | male | ||
| Brad | white | male | Jermaine | black | male | Meredith | white | female | ||
| Brendan | white | male | Jill | white | female | Neil | white | male | ||
| Brett | white | male | Kareem | black | male | Rasheed | black | male | ||
| Carrie | white | female | Keisha | black | female | Sarah | white | female | ||
| Darnell | black | male | Kenya | black | female | Tamika | black | female | ||
| Ebony | black | female | Kristen | white | female | Tanisha | black | female | ||
| Emily | white | female | Lakisha | black | female | Todd | white | male | ||
| Geoffrey | white | male | Latonya | black | female | Tremayne | black | male | ||
| Greg | white | male | Latoya | black | female | Tyrone | black | male |
The response variable of interest is whether or not there was a callback from the employer for the applicant, and there were 8 attributes that were randomly assigned that we’ll consider, with special interest in the race and sex variables. Race and sex are protected classes in the United States, meaning they are not legally permitted factors for hiring or employment decisions. The full set of attributes considered is provided in Figure 9.21.
| variable | description |
|---|---|
callback |
Specifies whether the employer called the applicant following submission of the application for the job. |
job_city |
City where the job was located: Boston or Chicago. |
college_degree |
An indicator for whether the resume listed a college degree. |
years_experience |
Number of years of experience listed on the resume. |
honors |
Indicator for the resume listing some sort of honors, e.g. employee of the month. |
military |
Indicator for if the resume listed any military experience. |
email_address |
Indicator for if the resume listed an email address for the applicant. |
race |
Race of the applicant, implied by their first name listed on the resume. |
sex |
Sex of the applicant (limited to only male and female in this study), implied by the first name listed on the resume. |
callback variable along with 8 other variables in the resume data set. Many of the variables are indicator variables, meaning they take the value 1 if the specified characteristic is present and 0 otherwise.All of the attributes listed on each resume were randomly assigned. This means that no attributes that might be favorable or detrimental to employment would favor one demographic over another on these resumes. Importantly, due to the experimental nature of this study, we can infer causation between these variables and the callback rate, if the variable is statistically significant. Our analysis will allow us to compare the practical importance of each of the variables relative to each other.
Modeling the probability of an event
Logistic regression is a generalized linear model where the outcome is a two-level categorical variable. The outcome, , takes the value 1 (in our application, this represents a callback for the resume) with probability and the value 0 with probability . Because each observation has a slightly different context, e.g. different education level or a different number of years of experience, the probability will differ for each observation. Ultimately, it is this probability that we model in relation to the predictor variables: we will examine which resume characteristics correspond to higher or lower callback rates.
Notation for a logistic regression model
The outcome variable for a GLM is denoted by , where the index is used to represent observation . In the resume application, will be used to represent whether resume received a callback () or not ().
The predictor variables are represented as follows: is the value of variable 1 for observation , is the value of variable 2 for observation , and so on.
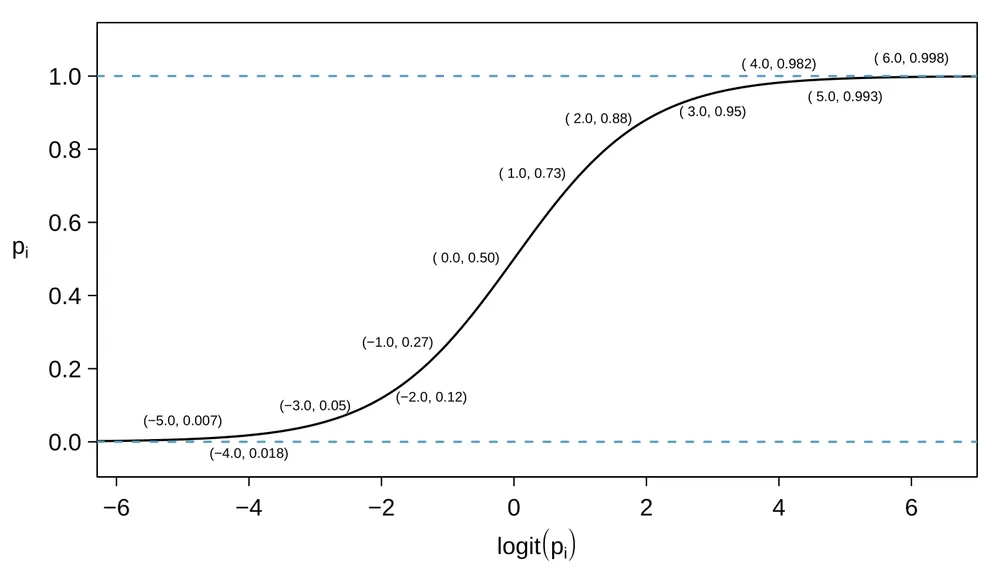
The logistic regression model relates the probability a resume would receive a callback () to the predictors , , ..., through a framework much like that of multiple regression: We want to choose a transformation in the equation that makes practical and mathematical sense. For example, we want a transformation that makes the range of possibilities on the left hand side of the equation equal to the range of possibilities for the right hand side; if there was no transformation for this equation, the left hand side could only take values between 0 and 1, but the right hand side could take values outside of this range. A common transformation for is the logit transformation, which may be written as The logit transformation is shown in Figure 9.22. Below, we rewrite the equation relating to its predictors using the logit transformation of : In our resume example, there are 8 predictor variables, so . While the precise choice of a logit function isn’t intuitive, it is based on theory that underpins generalized linear models, which is beyond the scope of this book. Fortunately, once we fit a model using software, it will start to feel like we’re back in the multiple regression context, even if the interpretation of the coefficients is more complex.
Example 9.29
We start by fitting a model with a single predictor: honors. This variable indicates whether the applicant had any type of honors listed on their resume, such as employee of the month. The following logistic regression model was fit using statistical software: (a) If a resume is randomly selected from the study and it does not have any honors listed, what is the probability resulted in a callback?
(b) What would the probability be if the resume did list some honors?
(a) If a randomly chosen resume from those sent out is considered, and it does not list honors, then honors takes value 0 and the right side of the model equation equals -2.4998. Solving for : . Just as we labeled a fitted value of with a “hat” in single-variable and multiple regression, we do the same for this probability: .
(b) If the resume had listed some honors, then the right side of the model equation is , which corresponds to a probability .
Notice that we could examine -2.4998 and -1.6330 in Figure 9.22 to estimate the probability before formally calculating the value.
To convert from values on the logistic regression scale (e.g. -2.4998 and -1.6330 in Example 9.29), use the following formula, which is the result of solving for in the regression model: As with most applied data problems, we substitute the point estimates for the parameters (the ) so that we can make use of this formula. In Example 9.29, the probabilities were calculated as While knowing whether a resume listed honors provides some signal when predicting whether or not the employer would call, we would like to account for many different variables at once to understand how each of the different resume characteristics affected the chance of a callback.
Building the logistic model with many variables
We used statistical software to fit the logistic regression model with all 8 predictors described in Figure 9.21. Like multiple regression, the result may be presented in a summary table, which is shown in Figure 9.23. The structure of this table is almost identical to that of multiple regression; the only notable difference is that the p-values are calculated using the normal distribution rather than the -distribution.
| Estimate | Std. Error | z value | Pr(z) | |
| (Intercept) | -2.6632 | 0.1820 | -14.64 | 0.0001 |
| job_city | -0.4403 | 0.1142 | -3.85 | 0.0001 |
| college_degree | -0.0666 | 0.1211 | -0.55 | 0.5821 |
| years_experience | 0.0200 | 0.0102 | 1.96 | 0.0503 |
| honors | 0.7694 | 0.1858 | 4.14 | 0.0001 |
| military | -0.3422 | 0.2157 | -1.59 | 0.1127 |
| email_address | 0.2183 | 0.1133 | 1.93 | 0.0541 |
| race | 0.4424 | 0.1080 | 4.10 | 0.0001 |
| sex | -0.1818 | 0.1376 | -1.32 | 0.1863 |
Just like multiple regression, we could trim some variables from the model. Here we’ll use a statistic called Akaike information criterion (AIC), which is an analog to how we used adjusted R-squared in multiple regression, and we look for models with a lower AIC through a backward elimination strategy. After using this criteria, the college_degree variable is eliminated, giving the smaller model summarized in Figure 9.24, which is what we’ll rely on for the remainder of this section.
| Estimate | Std. Error | z value | Pr(z) | |
| (Intercept) | -2.7162 | 0.1551 | -17.51 | 0.0001 |
| job_city | -0.4364 | 0.1141 | -3.83 | 0.0001 |
| years_experience | 0.0206 | 0.0102 | 2.02 | 0.0430 |
| honors | 0.7634 | 0.1852 | 4.12 | 0.0001 |
| military | -0.3443 | 0.2157 | -1.60 | 0.1105 |
| email_address | 0.2221 | 0.1130 | 1.97 | 0.0494 |
| race | 0.4429 | 0.1080 | 4.10 | 0.0001 |
| sex | -0.1959 | 0.1352 | -1.45 | 0.1473 |
Example 9.30
The race variable had taken only two levels: black and white. Based on the model results, was race a meaningful factor for if a prospective employer would call back?
We see that the p-value for this coefficient is very small (very nearly zero), which implies that race played a statistically significant role in whether a candidate received a callback. Additionally, we see that the coefficient shown corresponds to the level of white, and it is positive. This positive coefficient reflects a positive gain in callback rate for resumes where the candidate’s first name implied they were White. The data provide very strong evidence of racism by prospective employers that favors resumes where the first name is typically interpreted to be White.
The coefficient of in the full model in Figure 9.23, is nearly identical to the model shown in Figure 9.24. The predictors in this experiment were thoughtfully laid out so that the coefficient estimates would typically not be much influenced by which other predictors were in the model, which aligned with the motivation of the study to tease out which effects were important to getting a callback. In most observational data, it’s common for point estimates to change a little, and sometimes a lot, depending on which other variables are included in the model.
Example 9.31
Use the model summarized in Figure 9.24 to estimate the probability of receiving a callback for a job in Chicago where the candidate lists 14 years experience, no honors, no military experience, includes an email address, and has a first name that implies they are a White male.
We can start by writing out the equation using the coefficients from the model, then we can add in the corresponding values of each variable for this individual: We can now back-solve for : the chance such an individual will receive a callback is about 8.35%.
Example 9.32
Compute the probability of a callback for an individual with a name commonly inferred to be from a Black male but who otherwise has the same characteristics as the one described in Example 9.31.
We can complete the same steps for an individual with the same characteristics who is Black, where the only difference in the calculation is that the indicator variable will take a value of 0. Doing so yields a probability of 0.0553. Let’s compare the results with those of Example 9.31.
In practical terms, an individual perceived as White based on their first name would need to apply to jobs on average to receive a callback, while an individual perceived as Black based on their first name would need to apply to jobs on average to receive a callback. That is, applicants who are perceived as Black need to apply to 50% more employers to receive a callback than someone who is perceived as White based on their first name for jobs like those in the study.
What we’ve quantified in this section is alarming and disturbing. However, one aspect that makes this racism so difficult to address is that the experiment, as well-designed as it is, cannot send us much signal about which employers are discriminating. It is only possible to say that discrimination is happening, even if we cannot say which particular callbacks – or non-callbacks – represent discrimination. Finding strong evidence of racism for individual cases is a persistent challenge in enforcing anti-discrimination laws.
Diagnostics for the callback rate model
Logistic regression conditions
There are two key conditions for fitting a logistic regression model:
Each outcome is independent of the other outcomes.
Each predictor is linearly related to logit if all other predictors are held constant.
The first logistic regression model condition – independence of the outcomes – is reasonable for the experiment since characteristics of resumes were randomly assigned to the resumes that were sent out.
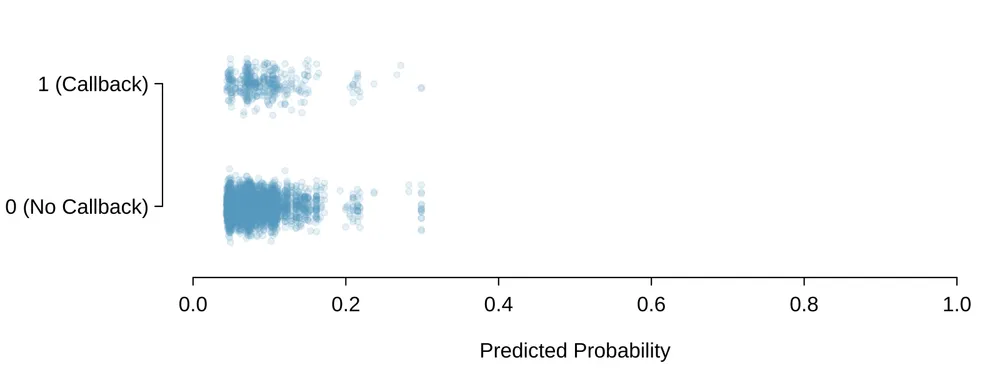
The second condition of the logistic regression model is not easily checked without a fairly sizable amount of data. Luckily, we have 4870 resume submissions in the data set! Let’s first visualize these data by plotting the true classification of the resumes against the model’s fitted probabilities, as shown in Figure 9.25.
We’d like to assess the quality of the model. For example, we might ask: if we look at resumes that we modeled as having a 10% chance of getting a callback, do we find about 10% of them actually receive a callback? We can check this for groups of the data by constructing a plot as follows:
Bucket the data into groups based on their predicted probabilities.
Compute the average predicted probability for each group.
Compute the observed probability for each group, along with a 95% confidence interval.
Plot the observed probabilities (with 95% confidence intervals) against the average predicted probabilities for each group.
The points plotted should fall close to the line , since the predicted probabilities should be similar to the observed probabilities. We can use the confidence intervals to roughly gauge whether anything might be amiss. Such a plot is shown in Figure 9.26.
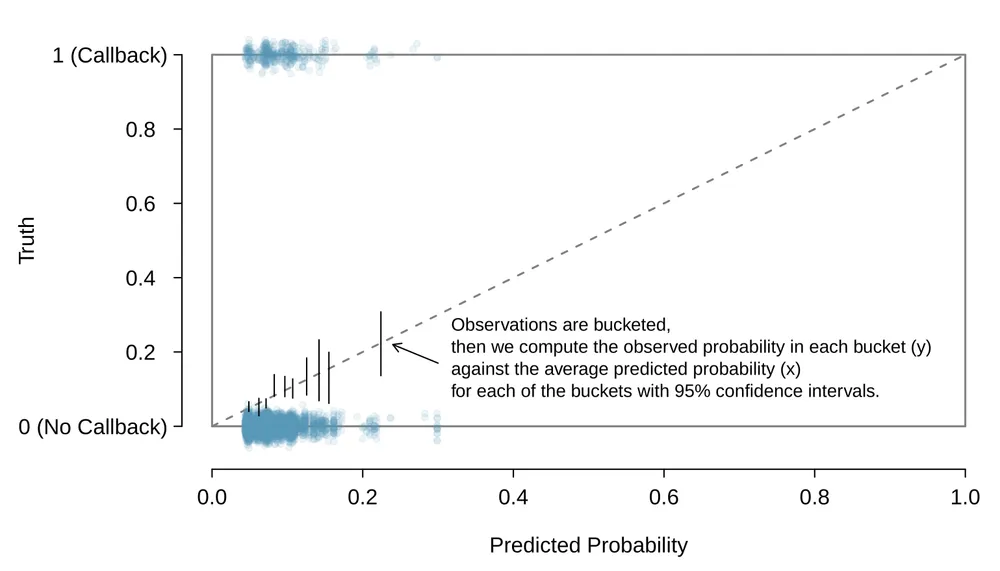
Additional diagnostics may be created that are similar to those featured in Section 9.3. For instance, we could compute residuals as the observed outcome minus the expected outcome (), and then we could create plots of these residuals against each predictor. We might also create a plot like that in Figure 9.26 to better understand the deviations.
Exploring discrimination between groups of different sizes
Any form of discrimination is concerning, and this is why we decided it was so important to discuss this topic using data. The resume study also only examined discrimination in a single aspect: whether a prospective employer would call a candidate who submitted their resume. There was a 50% higher barrier for resumes simply when the candidate had a first name that was perceived to be from a Black individual. It’s unlikely that discrimination would stop there.
Example 9.33
Let’s consider a sex-imbalanced company that consists of 20% women and 80% men,1 and we’ll suppose that the company is very large, consisting of perhaps 20,000 employees. Suppose when someone goes up for promotion at this company, 5 of their colleagues are randomly chosen to provide feedback on their work.
Now let’s imagine that 10% of the people in the company are prejudiced against the other sex. That is, 10% of men are prejudiced against women, and similarly, 10% of women are prejudiced against men.
Who is discriminated against more at the company, men or women?
Let’s suppose we took 100 men who have gone up for promotion in the past few years. For these men, random colleagues will be tapped for their feedback, of which about 20% will be women (100 women). Of these 100 women, 10 are expected to be biased against the man they are reviewing. Then, of the 500 colleagues reviewing them, men will experience discrimination by about 2% of their colleagues when they go up for promotion.
Let’s do a similar calculation for 100 women who have gone up for promotion in the last few years. They will also have 500 random colleagues providing feedback, of which about 400 (80%) will be men. Of these 400 men, about 40 (10%) hold a bias against women. Of the 500 colleagues providing feedback on the promotion packet for these women, 8% of the colleagues hold a bias against the women.
Example 9.33 highlights something profound: even in a hypothetical setting where each demographic has the same degree of prejudice against the other demographic, the smaller group experiences the negative effects more frequently. Additionally, if we would complete a handful of examples like the one above with different numbers, we’d learn that the greater the imbalance in the population groups, the more the smaller group is disproportionately impacted.2 Of course, there are other considerable real-world omissions from the hypothetical example. For example, studies have found instances where people from an oppressed group also discriminate against others within their own oppressed group. As another example, there are also instances where a majority group can be oppressed, with apartheid in South Africa being one such historic example. Ultimately, discrimination is complex, and there are many factors at play beyond the mathematics property we observed in Example 9.33.
We close this book on this serious topic, and we hope it inspires you to think about the power of reasoning with data. Whether it is with a formal statistical model or by using critical thinking skills to structure a problem, we hope the ideas you have learned will help you do more and do better in life.
Exercises
Exercise 9.15
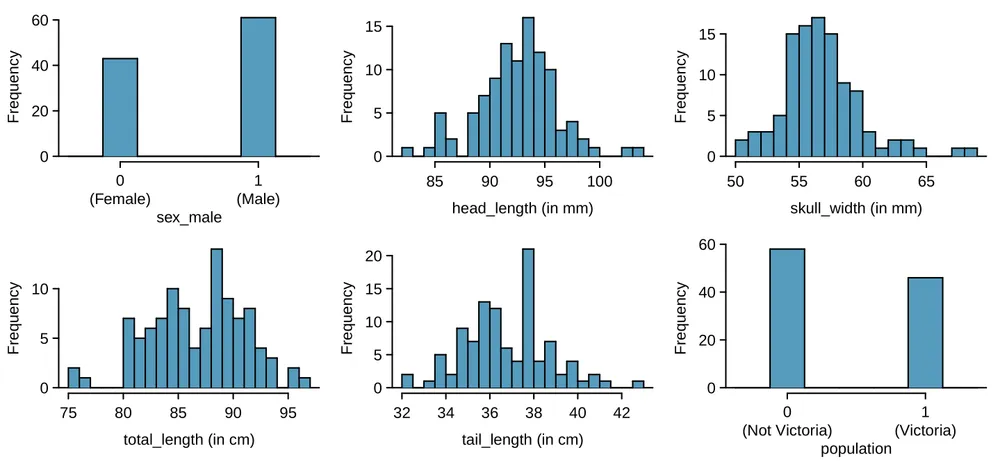
Possum classification, Part I. The common brushtail possum of the Australia region is a bit cuter than its distant cousin, the American opossum (see Figure 8.4). We consider 104 brushtail possums from two regions in Australia, where the possums may be considered a random sample from the population. The first region is Victoria, which is in the eastern half of Australia and traverses the southern coast. The second region consists of New South Wales and Queensland, which make up eastern and northeastern Australia. We use logistic regression to differentiate between possums in these two regions. The outcome variable, called population, takes value 1 when a possum is from Victoria and 0 when it is from New South Wales or Queensland. We consider five predictors: sex_male (an indicator for a possum being male), head_length, skull_ width, total_length, and tail_length. Each variable is summarized in a histogram. The full logistic regression model and a reduced model after variable selection are summarized in the table.
| Full Model | Reduced Model | ||||||||
| Estimate | SE | Z | Pr(Z) | Estimate | SE | Z | Pr(Z) | ||
| (Intercept) | 39.2349 | 11.5368 | 3.40 | 0.0007 | 33.5095 | 9.9053 | 3.38 | 0.0007 | |
| sex_male | -1.2376 | 0.6662 | -1.86 | 0.0632 | -1.4207 | 0.6457 | -2.20 | 0.0278 | |
| head_length | -0.1601 | 0.1386 | -1.16 | 0.2480 | |||||
| skull_width | -0.2012 | 0.1327 | -1.52 | 0.1294 | -0.2787 | 0.1226 | -2.27 | 0.0231 | |
| total_length | 0.6488 | 0.1531 | 4.24 | 0.0000 | 0.5687 | 0.1322 | 4.30 | 0.0000 | |
| tail_length | -1.8708 | 0.3741 | -5.00 | 0.0000 | -1.8057 | 0.3599 | -5.02 | 0.0000 | |
Examine each of the predictors. Are there any outliers that are likely to have a very large influence on the logistic regression model?
The summary table for the full model indicates that at least one variable should be eliminated when using the p-value approach for variable selection:
head_length. The second component of the table summarizes the reduced model following variable selection. Explain why the remaining estimates change between the two models.
Exercise 9.16
Challenger disaster, Part I. On January 28, 1986, a routine launch was anticipated for the Challenger space shuttle. Seventy-three seconds into the flight, disaster happened: the shuttle broke apart, killing all seven crew members on board. An investigation into the cause of the disaster focused on a critical seal called an O-ring, and it is believed that damage to these O-rings during a shuttle launch may be related to the ambient temperature during the launch. The table below summarizes observational data on O-rings for 23 shuttle missions, where the mission order is based on the temperature at the time of the launch. Temp gives the temperature in Fahrenheit, Damaged represents the number of damaged O- rings, and Undamaged represents the number of O-rings that were not damaged.
| Shuttle Mission | 1 | 2 | 3 | 4 | 5 | 6 | 7 | 8 | 9 | 10 | 11 | 12 | |||||||||||
| Temperature | 53 | 57 | 58 | 63 | 66 | 67 | 67 | 67 | 68 | 69 | 70 | 70 | |||||||||||
| Damaged | 5 | 1 | 1 | 1 | 0 | 0 | 0 | 0 | 0 | 0 | 1 | 0 | |||||||||||
| Undamaged | 1 | 5 | 5 | 5 | 6 | 6 | 6 | 6 | 6 | 6 | 5 | 6 | |||||||||||
| Shuttle Mission | 13 | 14 | 15 | 16 | 17 | 18 | 19 | 20 | 21 | 22 | 23 | ||||||||||||
| Temperature | 70 | 70 | 72 | 73 | 75 | 75 | 76 | 76 | 78 | 79 | 81 | ||||||||||||
| Damaged | 1 | 0 | 0 | 0 | 0 | 1 | 0 | 0 | 0 | 0 | 0 | ||||||||||||
| Undamaged | 5 | 6 | 6 | 6 | 6 | 5 | 6 | 6 | 6 | 6 | 6 |
Each column of the table above represents a different shuttle mission. Examine these data and describe what you observe with respect to the relationship between temperatures and damaged O-rings.
Failures have been coded as 1 for a damaged O-ring and 0 for an undamaged O-ring, and a logistic regression model was fit to these data. A summary of this model is given below. Describe the key components of this summary table in words.
Estimate Std. Error z value Pr(z) (Intercept) 11.6630 3.2963 3.54 0.0004 Temperature -0.2162 0.0532 -4.07 0.0000 Write out the logistic model using the point estimates of the model parameters.
Based on the model, do you think concerns regarding O-rings are justified? Explain.
Exercise 9.17
Possum classification, Part II. A logistic regression model was proposed for classifying common brushtail possums into their two regions in Exercise 9.15. The outcome variable took value 1 if the possum was from Victoria and 0 otherwise.
| Estimate | SE | Z | Pr(Z) | |
| (Intercept) | 33.5095 | 9.9053 | 3.38 | 0.0007 |
| sex_male | -1.4207 | 0.6457 | -2.20 | 0.0278 |
| skull_width | -0.2787 | 0.1226 | -2.27 | 0.0231 |
| total_length | 0.5687 | 0.1322 | 4.30 | 0.0000 |
| tail_length | -1.8057 | 0.3599 | -5.02 | 0.0000 |
Write out the form of the model. Also identify which of the variables are positively associated when controlling for other variables.
Suppose we see a brushtail possum at a zoo in the US, and a sign says the possum had been captured in the wild in Australia, but it doesn’t say which part of Australia. However, the sign does indicate that the possum is male, its skull is about 63 mm wide, its tail is 37 cm long, and its total length is 83 cm. What is the reduced model’s computed probability that this possum is from Victoria? How confident are you in the model’s accuracy of this probability calculation?
Exercise 9.18
Challenger disaster, Part II. Exercise 9.16 introduced us to O-rings that were identified as a plausible explanation for the breakup of the Challenger space shuttle 73 seconds into takeoff in 1986. The investigation found that the ambient temperature at the time of the shuttle launch was closely related to the damage of O-rings, which are a critical component of the shuttle. See this earlier exercise if you would like to browse the original data.
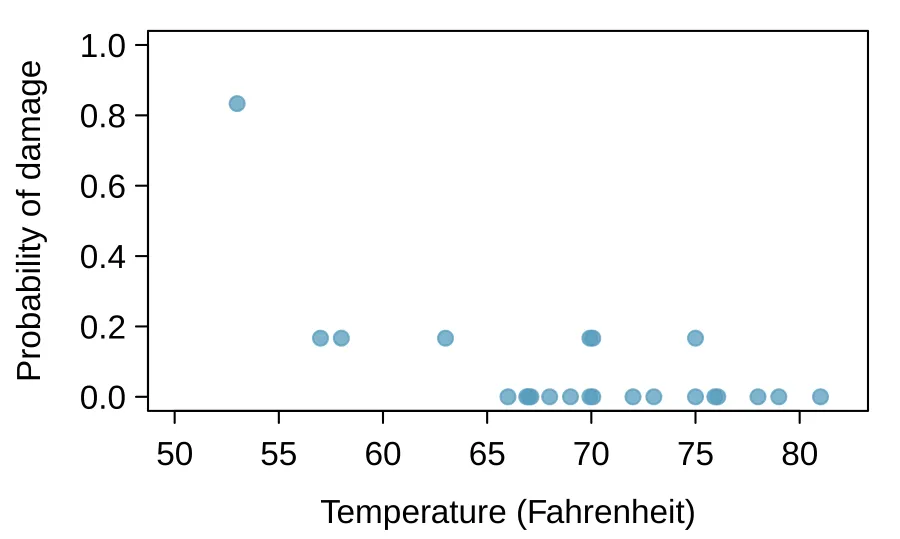
The data provided in the previous exercise are shown in the plot. The logistic model fit to these data may be written as where is the model-estimated probability that an O-ring will become damaged. Use the model to calculate the probability that an O-ring will become damaged at each of the following ambient temperatures: 51, 53, and 55 degrees Fahrenheit. The model-estimated probabilities for several additional ambient temperatures are provided below, where subscripts indicate the temperature:
Add the model-estimated probabilities from part (a) on the plot, then connect these dots using a smooth curve to represent the model-estimated probabilities.
Describe any concerns you may have regarding applying logistic regression in this application, and note any assumptions that are required to accept the model’s validity.
Notes
A more thoughtful example would include non-binary individuals. ↩
If a proportion of a company are women and the rest of the company consists of men, then under the hypothetical situation the ratio of rates of discrimination against women vs men would be given by ; this ratio is always greater than 1 when . ↩